Download
1 / 30
300 likes | 371 Views
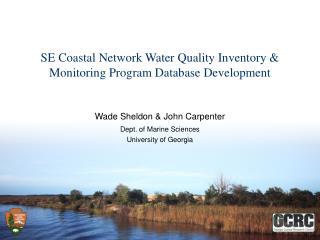
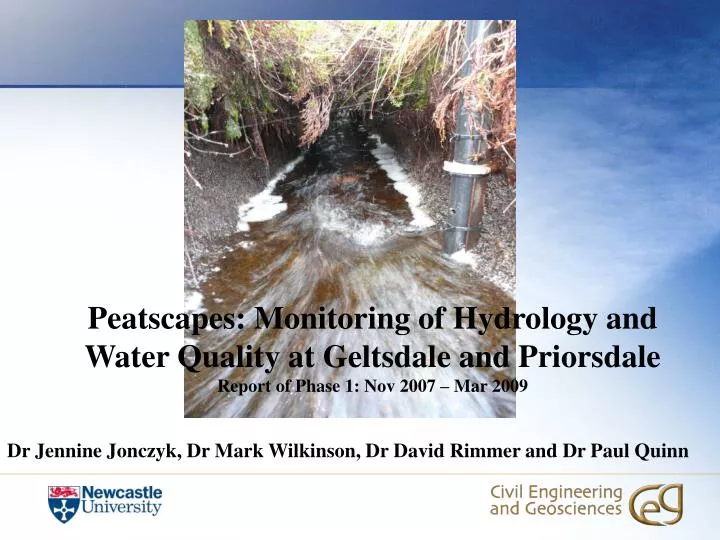
Peatscapes: Monitoring of Hydrology and Water Quality at Geltsdale and Priorsdale Report of Phase 1: Nov 2007 – Mar 2009. Dr Jennine Jonczyk, Dr Mark Wilkinson, Dr David Rimmer and Dr Paul Quinn. Some of the features in the catchment. 1.35km. 1.15km. 1.85km. R3. BEL. R1. R2.

E N D
Peatscapes: Monitoring of Hydrology and Water Quality at Geltsdale and Priorsdale Report of Phase 1: Nov 2007 – Mar 2009 Dr Jennine Jonczyk, Dr Mark Wilkinson, Dr David Rimmer and Dr Paul Quinn
Some of the features in the catchment 1.35km 1.15km 1.85km R3 BEL R1 R2 Upper Belford Burn “Pilot pond” Features 1 to 3 Pilot pond stream gauge Overland flow following gradient of slope Leaky wooden barrier PILOT POND STREAM SPILL Overflow Woodland Leakage R1 stream gauge Diversion structure Belford Burn Roughly 200m
Some of the features in the catchment 1.35km 1.15km 1.85km R3 BEL R1 R2 Upper Belford Burn “Pilot pond” Features 1 to 3
Some of the features in the catchment 1.35km 1.15km 1.85km R3 BEL R1 R2 Upper Belford Burn “Pilot pond” Features 1 to 3
…but that was last week! Lower Lady’s well feature
Outline • Questions to answer • Hydrology • WQ • Peatscapes II
Questions to answer • How does grip blocking effect :- • Water table • Water colour (& Dissolved Organic Carbon; DOC) • Suspended sediment • HOW are we investigating this? • (Water table) using pressure transducers in the peat • 2. (Colour) grab samples taken from grips and downstream pts and measuring DOC and absorbance in lab. • 3. (SS) Filtering grab sample
Working Hypothesis • ARE grips like open drainage ditches? • What happens when it rains? Q WT
Generic experimental Lay-out
Geltsdale Hydrology:- response in water table during Sept 08 storm
Observations in unblocked grips • No response in water table position - no matter where they are • Flashy spiky flow in grips.
Observations in blocked grip • Nice and smooth – less spiky and less flashy response in grip • Water table position is again not responding to flow
Working Hypothesis • Grips and Pipes are ‘off’ even though there may be a water table present • Small additions of percolating rain – connect all the pipes and grip together • What comes in goes out • When rain stops, flow stops and pipes empty Active flow paths in the acrotelm (top) layer pipes grip WT
Colour Water colour is caused by the presence of dissolved organic compounds – predominantly humic and fulvic acids, which are the products of decomposition from organic soils. Current EU Drinking water standard for Water colour is :- 20 Hazen Colour of River Tees is: 60-120 Hazen
Colour Geltsdale Priorsdale
DOC • Dissolved Organic carbon is derived from organic matter and has a strong correlation with WATER COLOUR. • DOC is an important component of the carbon cycle in streams and a primary food source. • Evidence for upward trend in DOC concentrations related to atmospheric deposition changes. (Worrall et al, 2004; Evans et al, 2006)
DOC Geltsdale Priorsdale
E4/E6 ratio Ratio of humic acid(E4) and fulvic acid(E6) Used to represent the degree of humification in peat Humification is decomposition of vegetation….. Ratio below 5 classified as humic above 5 classified as fulvic
E4/E6 ratio Geltsdale Priorsdale
Suspended Sediment • Some studies on IMPACTS of suspended sediments from peatlands • (Holden 2005, 2006; Rothwell et al 2005; Yeloff et al 2005; White et al 1996; Stewart 1963 ) • Little data on erosion rates or supply to main channels • (Holden 2007) • Ranges of SS from Holden 2007 at peak discharge were • Undisturbed catchment (1) - 2.5 mg/l • Grips (3) - 25-14 mg/l • Blocked grips (2) - 0.2- 0.14 mg/l
Suspended sediments Geltsdale Priorsdale
Pipes in the catotelm layer WT grip Peatscapes II New hydrological hypothesis Active flow paths in the acrotelm layer • Moving pressure transducers closer to the grip edge to see if there are any edge effects from unblocked grips • Mapping all observation sites to look at the effect of surface topography on the recorded depth to the water table • Putting pressure transducers in the shallow acrotelm layer to study the activity of runoff within the layer. The layer could be producing a temporary perched water table and the instruments will pick this up. • In Priorsdale we could move the flow gauge from one unblocked grip to the other to see if it has higher flow rates.
Summary • Hydrology • Unblocked grips respond rapidly to rainfall • RO smoothed in blocked grips • Some attenuation from blocked grip area and buffered by interaction with acrotelm area but still HIGH RO to main channels • New hypothesis- ON/OFF switch • WQ • No clear effect of blocking on colour and DOC at either site YET • Increase of colour and DOC in blocked (like Worrall et al , 2007 and Dodd, 2008) • Seasonality • Peatscapes II • Moving some instrumentation to test new hypothesis