Download
1 / 51
510 likes | 654 Views
Dyninst/Paradyn Week February, 2003. Automatic Performance Analysis and Tuning. Anna Morajko, Oleg Morajko, Tomas Margalef, Emilio Luque Universitat Autónoma de Barcelona. Content. Our goals – automatic analysis and tuning Automatic analysis based on ASL Dynamic tuning

E N D
Dyninst/Paradyn Week February, 2003 Automatic Performance Analysis and Tuning Anna Morajko, Oleg Morajko, Tomas Margalef, Emilio Luque Universitat Autónoma de Barcelona
Content • Our goals – automatic analysis and tuning • Automatic analysis based on ASL • Dynamic tuning • Conclusions and future work
Our goals Primary objectives • Create a tool that is able to automatically analyze the performance of parallel applications post-mortem and is based on trace files • Create a tool that is able to automatically analyze the performance of parallel applications on the fly, detect bottlenecks and explain their reasons • Create a tool that is able to automatically improve the performance of parallel applications during their execution without recompiling and rerunning them
Our goals Static automatic analysis • static trace file analysis supported by source code examination
Run-Time Analysis Application Performance data Properties Tracing, profiling Performance Monitor PropertyEvaluation Problems SearchRefinement ProblemRanking Measurement requests User output Bottlenecks Our goals Dynamic automatic analysis • based on declarative knowledge specification
Application development Source Problem / Solution User Application Modifications Exe-cution Instrumentation Tracing Tuning Events Tool Performance analysis Suggestions Our goals Dynamic automatic tuning
Content • Our goals – automatic analysis and tuning • Automatic analysis based on ASL • Performance data collection • Performance problem catalog (properties and ASL) • Performance analysis • Dynamic tuning • Conclusions and future work
Objectives • Analyze the performance of parallel applications during their execution • Automatically detect bottlenecks • Provide a clear explanation of the identified problems to developers • Correlate problems with the source code • Provide recommendations on possible solutions
Key Challenges • What is wrong in the application?Problem identification – bottlenecks • Where is the critical resource?Problem location (hardware, OS, source code) • When does it happen?How to organize problem search in time? • How important it is?How to compare the importance of different problems? • Why it happens?How to explain the reasons of the problem to the user?
Design Assumptions • Dynamic on-the-fly analysis • Knowledge specification based on ASL • Bottleneck detection (what axis) based on inductive reasoning (bottom-up approach) • Problem location identification (where axis) based on call-graph search • Tool primarily targeted to MPI-based parallel programs
Performance Analysis Concept Run-Time Analysis Application Performance data Properties Tracing, profiling Performance Monitor PropertyEvaluation Problems SearchRefinement ProblemRanking Measurement requests Bottlenecks User output
Performance Data Collection • Performance analysis is based on measurements of performance data • There are various techniques on providing this data • event tracing, sampling, instrumentation • Static data • Structural data (modules, functions), call graphs, etc. • Dynamic data • Metrics, execution profiles, communication patterns, events, etc.
Region Application Process Module N Function N Call graph Performance Data Collection Application model • We represent the application using object model • Model is generated dynamically at application startup (by parsing the executables) • Each object represents a location context called Region • This information can be used to guide problem location search
Region Profile App Profile Process Profile Module Profile N Function Profile Performance Data Collection Execution profile • Each region can have an execution profile - RegionProfile • Each profile contains a set of predefined metrics • Each metric can be measured on demand for a specific region • The key issue is to decide what metrics for what regions should be measured
Region Profile App Profile Process Profile Module Profile N Function Profile Performance Data Collection • Execution profile • Each region can have an execution profile - RegionProfile • Each profile contains a set of predefined metrics • Each metric can be measured on demand for a specific region • The key issue is to decide what metrics for what regions should be measured cpu_timeio_time comm_time sync_time idle_timenum_exec
Performance Properties • Properties describe the specific types of performance behavior in a program • Properties are higher-level abstractions used to represent common performance problems • They are based on conditions dependent on certain performance metrics • We can express these abstractions using ASL (APART Specification Language)
APART Specification Language • ASL is a declarative language (like SQL) propertysmall_io_requests (Region r, Experiment e, Region basis){let float cost = profile (r,e).io_time;int num_reads = profile (r,e).num_reads; int bytes_read = profile (r,e).bytes_read; in condition : cost > 0 and bytes_read/num_reads < SMALL_IO_THRESHOLD; confidence: 1; severity : cost/duration (basis, e); }
Property Evaluation Region profile int foo () { open („sim.dat”, O_RDONLY); for (...) { read (block, ...); ... add (block); } ... } Function foo ()Profile io_time 181 secnum_reads 8921 bytes_read 95201 Region Function foo () File: foo.cpp Lines: 17-35 propertysmall_io_requests (Region r, Experiment e, Region basis){let float cost = profile (r,e).io_time;int num_reads = profile (r,e).num_reads; int bytes_read = profile (r,e).bytes_read; in condition : cost > 0 and bytes_read/num_reads < SMALL_IO_THRESHOLD; confidence: 1; severity : cost/duration (basis, e); } condition: true confidence: 1 severity: 0.35
Hierarchical Properties • During run-time all properties cannot be evaluated at once (metrics cost!) • But we want to find a problem and keep the cost controlled • So what properties to evaluate? • Properties have natural dependences • Let’s express dependencies explicitly in ASL • This can guide the automatic search and limit the number of properties to be evaluated
Example propertycommunication_cost (Region r, Experiment e, Region basis){let float cost = profile (r,e).sums.comm_time; in condition : cost > 0; confidence: 1; severity : cost/duration (basis, e); } • Analyzer should evaluate the late_sender property only if communication_cost property holds • Properties create natural hierarchies propertylate_sender (Region r, Experiment e, Region basis){let float idleT = profile (r,e).sums.idle_time; in condition : r.type == Receive and idleT > 0; confidence: 1; severity : idleT/duration (basis, e); }
Example: Hierarchy of properties Cost I/O Cost Sync Cost Comm Cost ... Slow Read Barrier Lock Contention Small Msgs ... Small Requests Late Sender Late Receiver Large Requests ... ...
Search Process • Top-down approach • Start with top-level property, i.e. • Cost = io_time, comm_time, sync_time • Start with search location = process • Perform measurements • Evaluate the property • Severity = cost/duration (e.g. 40%)
Search Process • Continue with set of sub-properties: • evaluate io_cost, comm_cost, sync_cost • E.g. highest severity is io_cost (e.g. 25%) • Continue the top-down search until reaching most specific property, i.e. small_io_requests • Next, try looking for more precise location of the problem • use call-graph region search • start from main • step down until reaching foo () function
Generic Analysis Algorithm Change search context or select next property Select search context (Region) Select property to evaluate Rank property Determine required metrics from property Evaluate property „Order” metrics for a given context Wait for data. Update execution profile.
Content • Our goals – automatic analysis and tuning • Automatic analysis based on ASL • Dynamic tuning • Objectives • MATE (Monitoring, Analysis and Tuning Environment) • Tuning techniques and experiments • Conclusions and future work
Objectives Improve the execution of a parallel application by dynamically adapting it to the environment Key issues: • Dynamic performance tuning approach • Automatic improvement of any application without recompiling and rerunning it • What can be tuned in an unknown application? • Library usage • Operating system usage MATE – Monitoring, Analysis and Tuning Environment • prototype implementation in C++ • for PVM based applications • Sun Solaris 2.x / SPARC
Machine 1 Machine 2 Apply solutions Task1 Task1 Task2 Instrument Instrument Events Events Machine 3 MATE Tuner Tuner Monitor Monitor pvmd pvmd Analyzer
Machine 1 Task2 Task1 Instrument Via DynInst lib lib Monitor add event/ remove event Machine 2 events events Analyzer MATE: Monitoring Monitors control execution of application tasks and allow for dynamic event tracing Key services: • Distributed application control • Instrumentation management • AddEventTrace(id,func,place,args) • RemoveEventTrace(id) • Transmission of requested event records to analyzer
Machine 1 Task1 lib instrument pvm_send (params) { } load Monitor entry exit LogEvent (params) { ... } 1 0 64884 524247262149 1 23 TCP/IP Analyzer MATE: Monitoring Instrumentation management: • Based on DynInst API • Dynamically loads tracing library • Inserts snippets into requested points • A snippet calls a library function • A function prepares event record and transmits it to the Analyzer Event record: • What- event type (id, place) • When- global timestamp • Where– task identifier • Requested attributes - function call parameters, source code line number, etc.
1. Request events 2. Collect events 6. Perform tuning 3. Calculate metrics 4. Evaluate performance model 5. Refine monitoring MATE: Analysis Analyzer is responsible for the automatic performance analysis on the fly • Uses a set of predefined tuning techniques • Each technique is specified as: • measure points – what events are needed • performance model and activating conditions • solution - tuning actions/points/synchronization - what to change, where, when
thread MATE: Analysis Events (from tracing library) via TCP/IP Tuning technique Event Collector Tuning technique Tuning technique Tuning request (to tuner) via TCP/IP Event Processor Tuning Manager Analyzer Instrumentation request (to monitor) via TCP/IP Instr Manager Metric Repository
MATE: Knowledge Measure point example: Insert instrumentation intoALL tasks at entry of function pvm_send() as eventId 1 record parameter 1 as int parameter 2 as int <intrumentation_request taskId=all> <function name=“pvm_send”> <eventId>1</eventId> <place>entry</place> <param idx=1>int</param> <param idx=2>int</param> </function></intrumentation_request>
MATE: Knowledge Performance model example: CurrentSize = result of pvm_getopt (PvmFragSize) OptimalSize = Average (MsgSize) + Stddev (MsgSize) Condition: CurrentSize – OptimalSize > threshold1 CommunicationCost = xxx Condition: Communication cost > threshold2 <performance_model> <value name=CurrentSize> <calc> <type>function_result</type> <function name=“pvm_getopt”> <param>PvmFragSize</param> </function> </calc> </value> ... </performance_model>
MATE: Knowledge Solution example: In task with tid=524247, execute one time a function pvm_setopt(PvmFragSize, 16384) breaking at entry of function pvm_send() <tuning_request taskId=524247> <action> <one_time_call> <function name=„pvm_setopt”> <param idx=0>PvmFragSize</param><param idx=1>16384</param> </function> <synchronize> <breakpoint><function name=„pvm_send”> <place>entry</place> </function> </breakpoint> </synchronize> </one_time_call> </action></tuning_request>
MATE: Tuning Tunersapply solutions by executing tuning actions at specified tuning points • A tuner module is integrated with monitor process • Receivesa tuning request from analyzer • Prepares modifications (snippets) • Applies modifications via DynInst Tuner/Monitor recv_req (taskId, TuningReq) { Task task = taskList.Find (taskId); snippet = PrepareSnippet (TuningReq); task.thread.insertSnippet (snippet); } Analyzer TuningReq () { send_req (tuner, taskId, tuningReq); }
MATE: Tuning Tuning request: • Tuner machine • Task id • Tuning action • One time function call • Function parameter changes • Function call • Function replacement • Variable changes • Tuning points as pairs: object, value • function – name, param – name, param – value • Synchronization • When to perform tuning action In task with tid=524247, callone time a function pvm_setopt(PvmFragSize, 16384) breaking at entry of function pvm_send()
Tuning techniques What can be tuned? • Library usage • Tuning of PVM library usage • Investigating PVM bottlenecks • PVM communication bottlenecks: • Communication mode • Data encoding mode • Message fragment size
Tuning techniques Communication mode • 2 modes: • indirect - task to daemon to daemon to task • direct - task to task • Indirect is slow, but default • Direct is faster, but consumes socket resources (limited number of connections) Benefits when changing communication mode to directin a round trip application
Tuning techniques Communication mode Current communication mode:pvm_getopt(PvmRoute) New task creation: pvm_spawn() Measure points Non shared-memory architecture Indirect mode Number of PVM tasks smaller than system limit Activating conditions Tuning action One time function call Tuning points pvm_setopt(PvmRoute, PvmRouteDirect) Synchronization Break at entry of pvm_send()
Tuning techniques Data encoding mode • 2 modes • XDR – allows for transparent transfer between heterogeneous machines, slower mode • DataRaw – encoding phase is skipped, possible when VM contains homogeneous machines • XDR – more data to be transferred, more time required to encode/decode it, by default • Big endian/little endian problem • DataRaw - more effective for integer data Benefits when changing encoding mode to DataRawin a round trip application
Tuning techniques Data encoding mode Hosts’ architecture: pvm_config(), pvm_addhosts(), pvm_delhost() Measure points All machines from the PVM virtual machine have the same architecture Activating conditions Tuning action Function parameter change pvm_initsend(PvmDataDefault) -> pvm_initsend(PvmDataRaw) Tuning points None Synchronization
Tuning techniques Message fragment size • Message divided into fixed-size fragments, default 4KB fragments • Larger message -> more fragments, hence • bigger fragment -> more data sent • Optimal fragment size depends on exchanged data size • Effective when direct communication mode used • Drawback: increased memory usage Benefits when changing 4KB message fragment size in a round trip application
Tuning techniques Message fragment size Current fragment size: pvm_getopt (PvmFragSize) Message size: pvm_send() Measure points High frequency of messages with size > 4KB OptimalFragSize = Average (MsgSize) + Stddev (MsgSize) CurrentFragSize – OptimalFragSize > threshold1 Communication cost > threshold2 Activating conditions Tuning action One time function call Tuning points pvm_setopt(PvmFragSize, OptimalFragSize) Synchronization Break at entry of pvm_send()
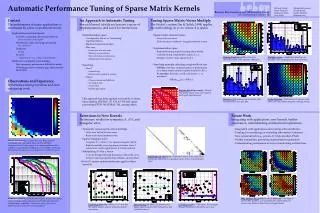
Tuning techniques: Example application • Integer Sort Kernel benchmark from NAS • High communication cost (50%) • Default settings: indirect communication mode, DataRaw encoding, message fragment size 4KB
Other tuning techniques Other: • TCP/IP • send/receive buffer size • sending without delay (Nagle’s algorithm, TCP_NO_DELAY) • I/O • read/write operations • using prefetch when small requests • using asynchronous read/write instead of synchronous • I/O buffer size • Memory allocation • plugging-in specialized strategies (pool allocator)
Content • Our goals – automatic analysis and tuning • Automatic analysis based on ASL • Dynamic tuning • Conclusions and future work
Conclusions • Automatic performance analysis • Dynamic tuning • Designs • Experiments
Future work Automatic analysis • Discuss and close detailed ASL language specification • Complete property evaluator • Connect the analyzer with performance measurement tool • Investigate the „why-axis” analysis(Evaluate the casual property chains)
Future work Dynamic tuning • Approaches: • Black box – tuning of ANY application • more tuning techniques • Cooperative – tuning of prepared application • supported by program specification, • application developed using framework • knowledge about tuning techniques provided by an application framework