UX for Connected Vehicles Kevin McCullagh
UX for Connected Vehicles Kevin McCullagh. February 2016. We help companies work out what to do next with their products ...and why. Where’s the future value? Infotainment Driver assistance Insurance data Vehicle health. 33%. don’t use their head-up display.

UX for Connected Vehicles Kevin McCullagh
E N D
Presentation Transcript
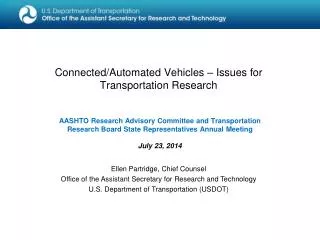
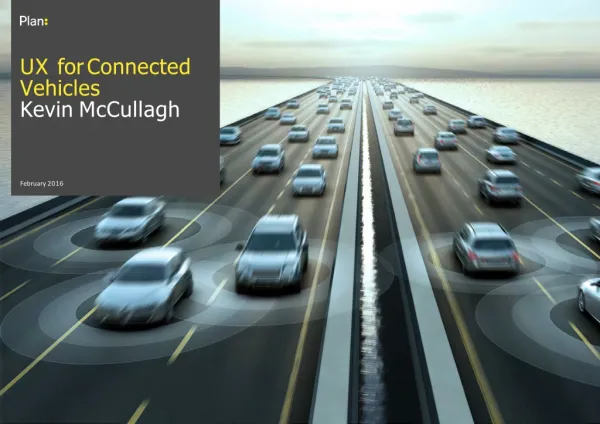
UX forConnected Vehicles KevinMcCullagh February2016
Wehelpcompaniesworkout whattodonextwiththeirproducts ...andwhy
Where’s the futurevalue? Infotainment Driverassistance Insurance data Vehiclehealth
33% don’t use their head-updisplay Source: Automakers Spending Billions on Technologies That Many Consumers Don’t Use, J.D. Power, August2015
Drivers arealready facing information overload 17,000 Call-outs to the UK’s AA breakdown service per month from drivers baffled by unfamiliar warninglights Source: The AA, September 2015
Handsfreedoesn’t meansafe Reduction in reactiontimes 56% using a hand-held phone 46%using a hands-free phone 18% after drinking the legal limit ofalcohol Source: RAC & Transport Research Laboratory,2008
Section Slide16 ‘People wantthe displays on the vehicle to look just like those on theirphone.’ Tim Yeardon,Visteon Source: ‘Ask the Experts, ‘ www.cardesignnews.com, August2015
60% of Chinese consumers said they would be willing to switch car manufacturer if it offered full access to their applications, data andmedia Source: McKinsey Connectivity and autonomous Driving Consumer Survey2015
The answer isnot morescreens #SiliconValleyDoesn’tHaveAllTheAnswers
More visceralinteractions Source: Jaguar Land Rover Bike Sense. Seat shoulder taps the & rings a bicycle bell if it senses a cyclist near the car and Door handles ‘buzz’ to prevent doors being opened into the path ofbikes
Contextual awareness Computers shouldn’t ask questionsthey should beable to work out themselves
‘Banishing the car from urban areas is becoming a common trend in many Europeancities.’ Jack Stewart, BBC Future news, February2014
Richer mobility serviceecosystem New mobility modes Multi-modal apps Seamlesspayments Squeeze on caruse Higher parking costs Congestion charging Lower speed limits Traffic-calming measures Stricter emission laws No-car developments Limited carzones More cardeterrents andalternatives 1980s High occupancyvehicle lanes in theUSA 2004 ZipCar launches 2014 London congestion nears pre-charginglevels 2030 Helsinki eliminates private-carownership 2040 DfT expects25% increase in traffic since2015 1982 Athens Ring Odd/Evensystem 2003 Londoncongestion chargingbegins 2010 Boris Bike schemelaunched 2020 Paris to ban diesel cars 2034 Hamburg to ban cars from centre
Mobilityservices Multi- modal payment Multi- modal planner Taxi hailing apps Parking services Navigation Mobilitymap Costandconvenience (Price/Comfort/Flexibility/Speed) Taxi Luxury chauffeur Privatecar Minicab Hailable minicab Micro carsharing Action zone Mini cab that can be hailed with an app, e.g.Uber For smaller (typically 3-5) pre-determined groups of users, e.g. AudiUnite Free- floating carsharing Dynamicminibus Uses data to determine routes and offer point to point pick-ups and drop-offs, e.g.Bridj Cars are collectedfromand returned to,anyparking space withinapre-defined area, e.g. DriveNow Point-to-point carsharing P2P carsharing Back-to-base carsharing Motorbike Car owners rent their cars directly toother consumers, e.g.RelayRides Bus Scooter Tram Metro e-bike Shared Scooter Bicycle with integrated electrical motor for propulsion, e.g. GoCycle Bike Shared bike Typicalurban journeylength Walk Source: 1km 2km 5km 10km 15km+
City gave its 430,000 residents free access to public transport in an attempt to get cars off the road, decrease congestion and make the city more accessible to low-incomeresidents. Tallinexperiment +1.2% increase in demand for the service overall
+57% UKcarsaleshitalltimerecordlevelsin2015 Source: SMMT,2015 Forecasted rise inglobal car sales by2030 Source: Euromonitor,2015 Carsalesatalltimehigh 2.65m 2.55m 2.45m 2.35m 2.25m 2.15m 2.05m 1.95m 1.85m 1.75m 2007 2009 2011 2013 2015
Continuity Private ownership will remain the dominantmodel Slow growth of EVs, predominantly in city centre carclubs Driverless cars will be just aroundcorner... Change Less diesel, more petrol hybrid Less pollution, more congestion More driver-assist technologies Apple and Googlewill ownInfotainment 2025
We join thedots @kevinmccull www.plan.london