Download
1 / 27
280 likes | 662 Views
ICRA’07, Rome Workshop on Space Robotics. Evaluation and Optimization of Rover Locomotion Performance. Thomas Thueer & Roland Siegwart. Machines that know what they do. Outline. Locomotion Concepts Metrics Aspects Locomotion Performance Example: Rover Comparison - Simulation & Hardware

E N D
ICRA’07, Rome • Workshop on Space Robotics Evaluation and Optimization of Rover Locomotion Performance Thomas Thueer & Roland Siegwart Machines that know what they do
Outline • Locomotion Concepts • Metrics • Aspects Locomotion Performance • Example: Rover Comparison - Simulation & Hardware • Improving Locomotion Performance • Conclusion and Outlook
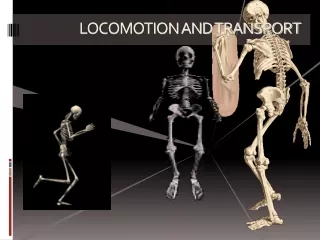
Locomotion Concepts • How to design wheeled rovers for rough terrain?
Characteristics of Locomotion Mechanisms • Trafficability: capacities to drive over a loose terrain • Main parameters: • Wheel-Ground Contact • Distribution of Mass • Maneuverability: mainly the steering capacities • Locomotion mechanism (steering of wheels) • Type of contact with ground • Terrainability: capacities to cross obstacles and maintain stability • Locomotion mechanism • Mass distribution • Type of contact, number and distribution of contact point
Wheeled Rovers (RCL):Concepts for Object Climbing Purely frictionbased Change of center of gravity(CoG) Adapted suspension mechanism with passive or active joints
Metrics • Necessary for proper comparison of different systems • “Know what conclusion you want to derive” • Requirements • Precise definition • Measurable • Objectivity / independent from specific parameters • Ideally available in simulation and reality • Apply to normalized systems • Absolute / relative comparison • Level of accuracy (requirements, level of knowledge of final design)
Metrics – Overview • Metrics for different aspects of performance • Terramechanics • Obstacle negotiation capabilities • Metrics for sub-systems • Evaluation independently from rover • Same performance of sub-system on different rovers • E.g. Rover Chassis Evaluation Tools (RCET) activity for wheel characterization
MetricsTerramechanical & Geometrical Aspects • Analysis of wheel ground interaction based on Bekker • Drawbar pullEqual for all rovers if normalized, independent from suspension • Slope gradeabilityDepends on suspension that defines normal force distribution on slope • Static stability • See slope gradeability • Geometrical analysis not sufficient!
MetricsObstacle Negotiation (Terrainability) • Minimum friction requirement • Minimizing risk of slippage/getting stuck in unknown terrain • Optimization: equal friction coefficients • Minimum torque requirement • Minimizing weight and power consumption • Slip • Bad for odometry, loss of energy
Example: Rover Comparison - Simulation & Hardware • Comparison of different rovers • CRAB (sim. & HW) • RCL-E (sim. & HW) • MER – rocker bogie type rover (sim.)
Example: Rover Comparison –Simulation Setup • Performance Optimization Tool (2DS – RCET) • Static, 2D analysis • Fast calculation allows for parametrical studies: optimization of structures • Over actuated systems: optimization of wheel torques • Results reflect full potential of structure(not influenced by parameter tuning, control algorithm) • Simulations • Benchmark: step obstacle (tough task for wheeled rovers) • Rovers normalized (mass, wheels, track, CoG, load dist.) • Models with respect to breadboard dimensions/weight
Example: Rover Comparison –Simulation Results • Equally good performance of CRAB and MER • Different forward and backward performance of asymmetric systems as potential drawback Required friction coefficient [-] Required torque [Nm]
Rover Comparison – Experimental Setup • Rovers • Modular design: same wheels and electronics • GenoM software framework • Motors: Maxon RE-max 22 Watt; EPOS controllers • Equal footprint (0.65 m), similar weight (32-35 kg) • Test runs • Control: velocity, velocity with wheel synchronization • Two types of obstacle coating (rough, carpet-like) • Step (wheel diameter high) • At least 3 runs; log of currents, encoder values
Example: Rover Comparison – Experimental Results (1) • CRAB • Success rate: SR = 100 % • Slippage: Slip = 0.3 m • RCL-E • Success rate: SR = 0 %Wheels blocked because of insufficient torque • Modification of controller settings: Maximum current increased (2.5 A 3.5 A; 8.6 Nm 12 Nm) • Success rate: SR = 47 % • Slippage: Slip = 0.41 m
Example: Rover Comparison – Video of Testing Hardware tests with CRAB and RCL-E
Example: Rover Comparison – Experimental Results (2) saturation • Rover: CRAB • Successful test run • Peaks indicate obstacle climbing of wheels • Current graph • Saturation at 2.5A • Negative currents occur • Distance graph (encoders) • Normal inclination wheel moving or slipping • Reduced inclination wheel blocked negative currents wheels blocked
Example: Rover Comparison – Experimental Results (3) • Rover: RCL-E • Failed test: rover blocked (current limit at 2.5 A) • Rear wheel saturated • Front and middle wheel slip • Successful test(current limit at 3.5 A) • Current back wheel > 2.5 A • Front and middle wheel: currents similar as above • Problems in climbing phase can be detected (oscillation of signal) wheels slipping wheel slipping - lack of grip
Example: Rover Comparison –Simulation vs. Experiments • Qualitative Analysis • Strong correlation predictions – measurements • Significantly higher torque (SR = 0 %, 2.5 A) and friction coefficient (SR = 47 %, 3.5 A) of RCL-E than CRAB (SR = 100 %, 2.5 A) • Same ranking simulation/hardware for all metrics • Quantitative Analysis • Discrepancy of numerical values (~40 %) • Static, ideal model • Validation of simulations through hardware tests (Ref: Thueer, Krebs, Lamon & Siegwart, JFR Special Issue on Space Robotics, 3/2007)
Challenging Environment on Mars • Spirit and Opportunity Robots on Mars – since 24.1.2004
Motion Control – Tactile Wheels • Improvement of locomotion performance through motion control • Control types • Torque control • Kinematics based velocity control • Need for tactile wheel • Wheel ground contact angle required • First prototype on Octopus • Development of new “metallic“ wheel
Flexible Wheels • Better tractive performance • Lower total motion resistance Courtesy of DLR Köln
Conclusion • Locomotion mechanisms and their characteristics • Metrics for different aspects of performance • Example of evaluation and comparison of systems • Focus on obstacle negotiation aspect of locomotion performance • Static 2D analysis in simulation • Verfication and validation with hardware • How to improve performance • Motion control • Tactile wheel as sensor for wheel ground contact angle
Outlook 3.2 m • Continuous Flight on Mars
Thanks for your attention! • Acknowledgement • This work was partially supported through the ESA ExoMars Program and conducted in collaboration with Oerlikon Space, DLR and vH&S Questions ?