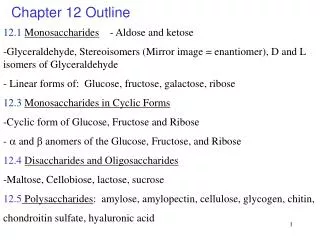
CHAPTER 12 OUTLINE
420 likes | 808 Views
CHAPTER 12 OUTLINE. 12.1 Monopolistic Competition 12.2 Oligopoly 12.3 Price Competition 12.4 Competition versus Collusion: The Prisoners’ Dilemma 12.5 Implications of the Prisoners’ Dilemma for Oligopolistic Pricing 12.6 Cartels. Monopolistic Competition and Oligopoly.

CHAPTER 12 OUTLINE
E N D
Presentation Transcript
CHAPTER 12 OUTLINE 12.1 Monopolistic Competition 12.2 Oligopoly 12.3 Price Competition 12.4 Competition versus Collusion: The Prisoners’ Dilemma 12.5 Implications of the Prisoners’ Dilemma for Oligopolistic Pricing 12.6 Cartels
Monopolistic Competition and Oligopoly ●monopolistic competition Market in which firms can enter freely, each producing its own brand or version of a differentiated product. ●oligopoly Market in which only a few firms compete with one another, and entry by new firms is impeded. ●cartel Market in which some or all firms explicitly collude, coordinating prices and output levels to maximize joint profits.
12.1 MONOPOLISTIC COMPETITION • The Makings of Monopolistic Competition A monopolistically competitive market has two key characteristics: 1. Firms compete by selling differentiated products that are highly substitutable for one another but not perfect substitutes. In other words, the cross-price elasticities of demand are large but not infinite. 2. There is free entry and exit: it is relatively easy for new firms to enter the market with their own brands and for existing firms to leave if their products become unprofitable.
12.1 MONOPOLISTIC COMPETITION • Equilibrium in the Short Run and the Long Run Figure 12.1 A Monopolistically Competitive Firm in the Short and Long Run Because the firm is the only producer of its brand, it faces a downward-sloping demand curve. Price exceeds marginal cost and the firm has monopoly power. In the short run, described in part (a), price also exceeds average cost, and the firm earns profits shown by the yellow-shaded rectangle.
12.1 MONOPOLISTIC COMPETITION • Equilibrium in the Short Run and the Long Run Figure 12.1 (continued) A Monopolistically Competitive Firm in the Short and Long Run In the long run, these profits attract new firms with competing brands. The firm’s market share falls, and its demand curve shifts downward. In long-run equilibrium, described in part (b), price equals average cost, so the firm earns zero profit even though it has monopoly power.
12.1 MONOPOLISTIC COMPETITION • Monopolistic Competition and Economic Efficiency Figure 12.2 Comparison of Monopolistically Competitive Equilibrium and Perfectly Competitive Equilibrium Under perfect competition, price equals marginal cost. The demand curve facing the firm is horizontal, so the zero-profit point occurs at the point of minimum average cost.
12.1 MONOPOLISTIC COMPETITION • Monopolistic Competition and Economic Efficiency Figure 12.2 (continued) Comparison of Monopolistically Competitive Equilibrium and Perfectly Competitive Equilibrium Under monopolistic competition, price exceeds marginal cost. Thus there is a deadweight loss, as shown by the yellow-shaded area. The demand curve is downward-sloping, so the zero profit point is to the left of the point of minimum average cost. In both types of markets, entry occurs until profits are driven to zero. In evaluating monopolistic competition, these inefficiencies must be balanced against the gains to consumers from product diversity.
12.1 MONOPOLISTIC COMPETITION With the exception of Royal Crown and Chock Full o’ Nuts, all the colas and coffees are quite price elastic. With elasticities on the order of −4 to −8, each brand has only limited monopoly power. This is typical of monopolistic competition.
12.2 OLIGOPOLY • The Makings of Monopolistic Competition In oligopolistic markets, the products may or may not be differentiated. What matters is that only a few firms account for most or all of total production. In some oligopolistic markets, some or all firms earn substantial profits over the long run because barriers to entry make it difficult or impossible for new firms to enter. Oligopoly is a prevalent form of market structure. Examples of oligopolistic industries include automobiles, steel, aluminum, petrochemicals, electrical equipment, and computers.
12.2 OLIGOPOLY • Equilibrium in an Oligopolistic Market When a market is in equilibrium, firms are doing the best they can and have no reason to change their price or output. Nash Equilibrium Equilibrium in oligopoly markets means that each firm will want to do the best it can given what its competitors are doing, and these competitors will do the best they can given what that firm is doing. ●Nash equilibrium Set of strategies or actions in which each firm does the best it can given its competitors’ actions. ●duopoly Market in which two firms compete with each other.
12.2 OLIGOPOLY • The Cournot Model ●Cournot model Oligopoly model in which firms produce a homogeneous good, each firm treats the output of its competitors as fixed, and all firms decide simultaneously how much to produce. Figure 12.3 Firm 1’s Output Decision Firm 1’s profit-maximizing output depends on how much it thinks that Firm 2 will produce. If it thinks Firm 2 will produce nothing, its demand curve, labeled D1(0), is the market demand curve. The corresponding marginal revenue curve, labeled MR1(0), intersects Firm 1’s marginal cost curve MC1 at an output of 50 units. If Firm 1 thinks that Firm 2 will produce 50 units, its demand curve, D1(50), is shifted to the left by this amount. Profit maximization now implies an output of 25 units. Finally, if Firm 1 thinks that Firm 2 will produce 75 units, Firm 1 will produce only 12.5 units.
12.2 OLIGOPOLY • The Cournot Model ●reaction curve Relationship between a firm’s profit-maximizing output and the amount it thinks its competitor will produce. Figure 12.4 Reaction Curves and Cournot Equilibrium Firm 1’s reaction curve shows how much it will produce as a function of how much it thinks Firm 2 will produce. Firm 2’s reaction curve shows its output as a function of how much it thinks Firm 1 will produce. In Cournot equilibrium, each firm correctly assumes the amount that its competitor will produce and thereby maximizes its own profits. Therefore, neither firm will move from this equilibrium. ●Cournot equilibrium Equilibrium in the Cournot model in which each firm correctly assumes how much its competitor will produce and sets its own production level accordingly.
12.2 OLIGOPOLY • The Linear Demand Curve—An Example Two identical firms face the following market demand curve P = 30 – Q Also, MC1 = MC2 = 0 Total revenue for firm 1: R1 = PQ1 = (30 –Q)Q1 then MR1 = ∆R1/∆Q1 = 30 – 2Q1 –Q2 Setting MR1 = 0 (the firm’s marginal cost) and solving for Q1, we find Firm 1’s reaction curve: By the same calculation, Firm 2’s reaction curve: Cournot equilibrium: Total quantity produced:
12.2 OLIGOPOLY • The Linear Demand Curve—An Example If the two firms collude, then the total profit-maximizing quantity can be obtained as follows: Total revenue for the two firms: R = PQ = (30 –Q)Q = 30Q – Q2, then MR1 = ∆R/∆Q = 30 – 2Q Setting MR = 0 (the firm’s marginal cost) we find that total profit is maximized at Q = 15. Then, Q1 + Q2 = 15 is the collusion curve. If the firms agree to share profits equally, each will produce half of the total output:Q1 = Q2 = 7.5
12.2 OLIGOPOLY • The Linear Demand Curve—An Example Figure 12.5 Duopoly Example The demand curve is P = 30 − Q, and both firms have zero marginal cost. In Cournot equilibrium, each firm produces 10. The collusion curve shows combinations of Q1 and Q2 that maximize total profits. If the firms collude and share profits equally, each will produce 7.5. Also shown is the competitive equilibrium, in which price equals marginal cost and profit is zero.
12.2 OLIGOPOLY • First Mover Advantage—The Stackelberg Model ●Stackelberg model Oligopoly model in which one firm sets its output before other firms do. Suppose Firm 1 sets its output first and then Firm 2, after observing Firm 1’s output, makes its output decision. In setting output, Firm 1 must therefore consider how Firm 2 will react. P = 30 – Q Also, MC1 = MC2 = 0 Firm 2’s reaction curve: Firm 1’s revenue: And MR1 = ∆R1/∆Q1 = 15 – Q1 Setting MR1 = 0 gives Q1 = 15, and Q2 = 7.5 We conclude that Firm 1 produces twice as much as Firm 2 and makes twice as much profit. Going first gives Firm 1 an advantage.
12.3 PRICE COMPETITION • Price Competition with Homogeneous • Products—The Bertrand Model ●Bertrand model Oligopoly model in which firms produce a homogeneous good, each firm treats the price of its competitors as fixed, and all firms decide simultaneously what price to charge. P = 30 – Q MC1 = MC2 = $3 Q1=Q2 = 9, and in Cournot equilibrium, the market price is $12, so that each firm makes a profit of $81. Nash equilibrium in the Bertrand model results in both firms setting price equal to marginal cost: P1=P2=$3. Then industry output is 27 units, of which each firm produces 13.5 units, and both firms earn zero profit. In the Cournot model, because each firm produces only 9 units, the market price is $12. Now the market price is $3. In the Cournot model, each firm made a profit; in the Bertrand model, the firms price at marginal cost and make no profit.
12.3 PRICE COMPETITION • Price Competition with Differentiated Products Suppose each of two duopolists has fixed costs of $20 but zero variable costs, and that they face the same demand curves: Firm 1’s demand: Firm 2’s demand: Choosing Prices Firm 1’s profit: Firm 1’s profit maximizing price: Firm 1’s reaction curve: Firm 2’s reaction curve:
12.3 PRICE COMPETITION • Price Competition with Differentiated Products Figure 12.6 Nash Equilibrium in Prices Here two firms sell a differentiated product, and each firm’s demand depends both on its own price and on its competitor’s price. The two firms choose their prices at the same time, each taking its competitor’s price as given. Firm 1’s reaction curve gives its profit-maximizing price as a function of the price that Firm 2 sets, and similarly for Firm 2. The Nash equilibrium is at the intersection of the two reaction curves: When each firm charges a price of $4, it is doing the best it can given its competitor’s price and has no incentive to change price. Also shown is the collusive equilibrium: If the firms cooperatively set price, they will choose $6.
12.3 PRICE COMPETITION P&G’s demand curve for monthly sales: Assuming that P&G’s competitors face the same demand conditions, with what price should you enter the market, and how much profit should you expect to earn?
12.4 COMPETITION VERSUS COLLUSION:THE PRISONERS’ DILEMMA In our example, there are two firms, each of which has fixed costs of $20 and zero variable costs. They face the same demand curves: Firm 1’s demand: Firm 2’s demand: We found that in Nash equilibrium each firm will charge a price of $4 and earn a profit of $12, whereas if the firms collude, they will charge a price of $6 and earn a profit of $16. But if Firm 1 charges $6 and Firm 2 charges only $4, Firm 2’s profit will increase to $20. And it will do so at the expense of Firm 1’s profit, which will fall to $4. ●payoff matrix Table showing profit (or payoff) to each firm given its decision and the decision of its competitor.
12.4 COMPETITION VERSUS COLLUSION:THE PRISONERS’ DILEMMA ●noncooperative game Game in which negotiation and enforcement of binding contracts are not possible. ●prisoners’ dilemma Game theory example in which two prisoners must decide separately whether to confess to a crime; if a prisoner confesses, he will receive a lighter sentence and his accomplice will receive a heavier one, but if neither confesses, sentences will be lighter than if both confess.
12.4 COMPETITION VERSUS COLLUSION:THE PRISONERS’ DILEMMA We argued that P&G should expect its competitors to charge a price of $1.40 and should do the same. But P&G would be better off if it and its competitors all charged a price of $1.50. Because these firms are in a prisoners’ dilemma. No matter what Unilever and Kao do, P&G makes more money by charging $1.40.
12.5 IMPLICATIONS OF THE PRISONERS’ DILEMMAFOR OLIGOPOLISTIC PRICING • Price Rigidity ●price rigidity Characteristic of oligopolistic markets by which firms are reluctant to change prices even if costs or demands change. ●kinked demand curve model Oligopoly model in which each firm faces a demand curve kinked at the currently prevailing price: at higher prices demand is very elastic, whereas at lower prices it is inelastic.
12.5 IMPLICATIONS OF THE PRISONERS’ DILEMMAFOR OLIGOPOLISTIC PRICING • Price Rigidity Figure 12.7 The Kinked Demand Curve Each firm believes that if it raises its price above the current price P*, none of its competitors will follow suit, so it will lose most of its sales. Each firm also believes that if it lowers price, everyone will follow suit, and its sales will increase only to the extent that market demand increases. As a result, the firm’s demand curve D is kinked at price P*, and its marginal revenue curve MR is discontinuous at that point. If marginal cost increases from MC to MC’, the firm will still produce the same output level Q* and charge the same price P*.
12.5 IMPLICATIONS OF THE PRISONERS’ DILEMMAFOR OLIGOPOLISTIC PRICING • Price Signaling and Price Leadership ●price signaling Form of implicit collusion in which a firm announces a price increase in the hope that other firms will follow suit. ●price leadership Pattern of pricing in which one firm regularly announces price changes that other firms then match.
12.5 IMPLICATIONS OF THE PRISONERS’ DILEMMAFOR OLIGOPOLISTIC PRICING • Price Signaling and Price Leadership The interest rate that banks charge large corporate clients is called the prime rate. Because it is widely known, it is a convenient focal point for price leadership. The prime rate changes only when money market conditions cause other interest rates to rise or fall substantially. When that happens, one of the major banks announces a change in its rate and other banks quickly follow suit. Different banks act as leader from time to time, but when one bank announces a change, the others follow within two or three days.
12.5 IMPLICATIONS OF THE PRISONERS’ DILEMMAFOR OLIGOPOLISTIC PRICING • Price Signaling and Price Leadership Figure 12.8 The Kinked Demand Curve The prime rate is the rate that major banks charge large corporate customers for short-term loans. It changes only infrequently because banks are reluctant to undercut one another. When a change does occur, it begins with one bank, and other banks quickly follow suit. The corporate bond rate is the return on long-term corporate bonds. Because these bonds are widely traded, this rate fluctuates with market conditions.
12.5 IMPLICATIONS OF THE PRISONERS’ DILEMMAFOR OLIGOPOLISTIC PRICING • The Dominant Firm Model Figure 12.9 Price Setting by a Dominant Firm D is the market demand curve, and SF is the supply curve (i.e., the aggregate marginal cost curve) of the smaller fringe firms. The dominant firm must determine its demand curve DD. As the figure shows, this curve is just the difference between market demand and the supply of fringe firms. At price P1, the supply of fringe firms is just equal to market demand; thus the dominant firm can sell nothing. At a price P2 or less, fringe firms will not supply any of the good, so the dominant firm faces the market demand curve. At prices between P1 and P2, the dominant firm faces the demand curve DD.
12.5 IMPLICATIONS OF THE PRISONERS’ DILEMMAFOR OLIGOPOLISTIC PRICING • The Dominant Firm Model Figure 12.9 (continued) Price Setting by a Dominant Firm The dominant firm produces a quantity QD at the point where its marginal revenue MRD is equal to its marginal cost MCD. The corresponding price is P*. At this price, fringe firms sell QF Total sales equal QT.
12.6 CARTELS Producers in a cartel explicitly agree to cooperate in setting prices and output levels. • Analysis of Cartel Pricing Figure 12.10 Price Setting by a Dominant Firm TD is the total world demand curve for oil, and Sc is the competitive (non-OPEC) supply curve. OPEC’s demand DOPEC is the difference between the two. Because both total demand and competitive supply are inelastic, OPEC’s demand is inelastic. OPEC’s profit-maximizing quantity QOPEC is found at the intersection of its marginal revenue and marginal cost curves; at this quantity, OPEC charges price P*. If OPEC producers had not cartelized, price would be Pc, where OPEC’s demand and marginal cost curves intersect.
12.6 CARTELS Figure 12.11 The CIPEC Copper Cartel TD is the total demand for copper and Sc is the competitive (non-CIPEC) supply. CIPEC’s demand DCIPEC is the difference between the two. Both total demand and competitive supply are relatively elastic, so CIPEC’s demand curve is elastic, and CIPEC has very little monopoly power. Note that CIPEC’s optimal price P* is close to the competitive price Pc.
12.6 CARTELS In intercollegiate athletics, there are many firms and consumers, which suggests that the industry is competitive. But the persistently high level of profits in this industry is inconsistent with competition. This profitability is the result of monopoly power, obtained via cartelization. The cartel organization is the National Collegiate Athletic Association (NCAA). The NCAA restricts competition in a number of important ways. • To reduce bargaining power by student athletes, the NCAA creates and enforces rules regarding eligibility and terms of compensation. • To reduce competition by universities, it limits the number of games that can be played each season and the number of teams that can participate in each division.
12.6 CARTELS In 1996, the federal government allowed milk producers in the six New England states to cartelize. The cartel—called the Northeast Interstate Dairy Compact—set minimum wholesale prices for milk, and was exempt from the antitrust laws. The result was that consumers in New England paid more for a gallon of milk than consumers elsewhere in the nation. Studies have suggested that the cartel covering the New England states has caused retail prices of milk to rise by only a few cents a gallon. Why so little? The reason is that the New England cartel is surrounded by a fringe of noncartel producers.