Download
1 / 31
310 likes | 402 Views
Elephants in the Room: Big Problems in Florida’s Insurance Markets that Nobody Wants to Discuss. Governor’s Hurricane Conference May 26, 2010 Download at www.iii.org/presentations. Robert P. Hartwig, Ph.D., CPCU, President & Economist

E N D
Elephants in the Room: Big Problems in Florida’s Insurance Markets that Nobody Wants to Discuss Governor’s Hurricane Conference May 26, 2010 Download at www.iii.org/presentations Robert P. Hartwig, Ph.D., CPCU, President & Economist Insurance Information Institute 110 William Street New York, NY 10038 Tel: 212.346.5520 Cell: 917.453.1885 bobh@iii.org www.iii.org
Florida is America’s #1 Catastrophe Problem Exposure is Huge and Can Only Grow in the Future Despite Real Estate Collapse 2
Total Value of Insured Coastal Exposure in 2007* ($ Billions) $522B Increase Since 2004, Up 27% In 2007, Florida Still Ranked as the #1 Most Exposed State to Hurricane Loss, with $2.459 Trillion Exposure, an Increase of $522B or 27% from $1.937 Trillion in 2004 The Insured Value of All Coastal Property Was $8.9 Trillion in 2007, Up 24% from $7.2 Trillion in 2004 *Latest available. Source: AIR Worldwide eSlide – P6466 – The Financial Crisis and the Future of the P/C
Insured Coastal Exposure as a Percentage of Statewide Insured Exposure, 2007 Nearly 80% of all insured exposure in Florida is coastal, more than any other state Source: AIR Worldwide eSlide – P6466 – The Financial Crisis and the Future of the P/C
Value of Insured Residential Coastal Exposure in 2007 ($ Billions) Residential structures accounted for $1.24 trillion or slightly more than half (50.4%) of all coastal exposure in Florida in 2007, far more than any other state Source: AIR Worldwide eSlide – P6466 – The Financial Crisis and the Future of the P/C
Value of Insured Commercial Coastal Exposure, 2007 ($ Billions) Commercial structures accounted for $1.22 trillion or slightly less than half (49.6%) of all coastal exposure in Florida in 2007, second only to New York Source: AIR Worldwide eSlide – P6466 – The Financial Crisis and the Future of the P/C
Florida Population, 2000 – 2035P FL’s population will hit 20 million by 2016 and will add 2.5 million residents between 2010 and 2020 State population growth is expected to resume in 2010 (Millions) Decline in population is small and temporary Despite the Recent Crash in Real Estate Markets and Higher Unemployment, Florida Will Add Millions of New Resident in the Years Ahead, Putting More Strain on the State’s Fragile Insurance Markets Source: University of Florida, Bureau of Economic and Business Research; US Census Bureau; Insurance Information Institute eSlide – P6466 – The Financial Crisis and the Future of the P/C
US Insured Catastrophe Losses: Florida Accounts for More Insured Loss than Any Other State $100 Billion CAT Year is Coming Eventually, Likely Involving FL ($ Billions) 2009 CAT Losses Were Down 61% from 2008 2000s: A Decade of Disaster 2000s: $193B (up 117%) 1990s: $89B Florida’s Demographics and Land Use Policies Make it Certain that Catastrophe Losses in the State Will Rise in the Future Note: 2001 figure includes $20.3B for 9/11 losses reported through 12/31/01. Includes only business and personal property claims, business interruption and auto claims. Non-prop/BI losses = $12.2B. Sources: Property Claims Service/ISO; Insurance Information Institute. 8 12/01/09 - 9pm eSlide – P6466 – The Financial Crisis and the Future of the P/C
U.S. Significant Natural Catastrophes, 1950 – 2009Number of Events ($1+ Bill economic loss and/or 50+ fatalities) Losses due to tropical activity are rising, impacting Florida directly Sources: MR NatCatSERVICE
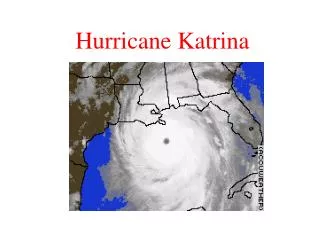
Top 12 Most Costly Disastersin US History—Most Have Impacted FL (Insured Losses, 2009, $ Billions) Hurricane Katrina Remains, By Far, the Most Expensive Insurance Event in US and World History Caused About $600 Million in Insured Losses in Florida 8 of the 12 Most Expensive Disasters in US History Have Occurred Since 2004; 8 of the Top 12 Disasters Affected FL Sources: PCS; Insurance Information Institute inflation adjustments. eSlide – P6466 – The Financial Crisis and the Future of the P/C
Distribution of US Insured CAT Losses: TX, FL, LA vs. US, 1980-2008* ($ Billions) Texas Louisiana Rest of US Florida Florida Accounted for 19% of All US Insured CAT Losses from 1980-2008: $57.1B out of $297.9B Insured Losses in FL Are Nearly Double that of Any Other State Over the Past 30 Years * All figures (except 2006-2008 loss) have been adjusted to 2005 dollars. Source: PCS division of ISO. eSlide – P6466 – The Financial Crisis and the Future of the P/C
Florida is America’s Most Dysfunctional but Not Most Uninsurable Property Insurance Market Rate Suppression, Not Hurricanes Are the Principal Source of Dysfunctionality 12
2010 Property and Casualty InsuranceReport Card: Regulatory Burden C - AK AL A WA ME B- B MT ND VT B- B- F NH MN A- D+ MA OR ID C+ NY WI B- CT SD = A = B = C = D = F = NG B RI C MI A B- NJ WY C B PA B- B+ C- IA B- B+ MD OH NE C+ DE NV IL IN WV C- A- D- UT VA B A- CO B- D- MO KY A D KS B B- B- CA NC D+ TN D+ B- OK SC C- B- AR AZ NM B- Source: James Madison Institute, February 2008. B- C- A HI AL GA MS B+ B NG LA TX Not Graded: District of Columbia Mississippi Louisiana NG FL D F Florida is one of only two states to receive a grade of “F” in 2010 Source: Heartland Institute, 2010 Property and Casualty Report Card: A State-by-State Analysis of Regulatory Burden, May 2010.
Cumulative Profits on Homeowners Insurance Transactions: 1985–2008 (Profits as a Share of Net Earned Premiums, e.g. -0.4 = -40%) Florida’s home insurers have been in the red on a cumulative basis since Hurricane Andrew struck the state in 1992 Note: Southeast states are AL, FL, GA, LA, MS, NC, SC and TX. Source: Robert W. Klein (2009), “Hurricane Risk and Property Insurance Markets: An Update and Extension,” Wharton Risk Center Working Paper #2009-10-07 based on data from NAIC Report on Profitability by Line by State and author’s calculations. 14
Average Homeowners Insurance Premium in Florida, 2007:Q2–2009:Q4 The state has required rates to be reduced even though they were not adequate to begin with. Discounts don’t make actuarial sense unless the discount is applied to an actuarially sound rate. Both factors have led most private insurers to reduce their presence in the state. ($ Billions) The average homeowners insurance premium as of 12/31/09 is down $274 or 14% since 3/31/07 The Passage HB1A in January 2007 and the Requirement to Provide Full Mitigation Discounts Since March 2007 Have Caused a Dramatic Loss in Premium Income and Caused Many Insurers to Lose Money Even Without a Major Hurricane Strike *HO-3 policies, excluding Florida Citizens. Source: Quarterly Supplemental Reports (QUASR) filed with the FL OIR, prepared by, prepared by Security First Insurance; Insurance Information Institute. 15 12/01/09 - 9pm eSlide – P6466 – The Financial Crisis and the Future of the P/C
Florida Home Insurance Rate Levels and Cumulative Change, 2007:Q1 vs. 2009:Q3 The average loss per policy $254.50 in 2007 to $421.22 in 2009, an increase of 65.5% Rates fell approximately 30% from 2007:Q1 through 2009:Q3 *All policy forms. Source: Quarterly Supplemental Reports (QUASR) filed with the FL OIR, prepared by prepared by Security First Insurance; Insurance Information Institute. 16
Florida Non-Hurricane Homeowner Loss Experience, 2007 vs. 2009 The frequency and severity (cost) of claims in Florida is up sharply (even excluding hurricane claims) while premiums have fallen, leading to losses for many insurers The average loss per policy $254.50 in 2007 to $421.22 in 2009, an increase of 65.5% *All policy forms. Source: Quarterly Supplemental Reports (QUASR) filed with the FL OIR, prepared by prepared by Security First Insurance; Insurance Information Institute. 17
Hostile Regulatory Environment is Ultimately Anti-Consumer Rate Suppression Leads to Reduced Consumer Choice, Less Competition, Weakening Among Some Insurers 18
U.S. Residual Market Exposure to Loss ($ Billions) Katrina, Rita and Wilma Florida accounted for 64% of all residual market exposure in 2009 4 Florida Hurricanes Hurricane Andrew (1992) In the 20-year period between 1990 and 2009, total exposure to loss in the residual market (FAIR & Beach/Windstorm) Plans has surged from $54.7 billion in 1990 to approximately $639 billion in 2009. *Preliminary 2009 PIPSO data. Includes 2008 data for TX, SC, MD, DC, OR and WA (latest data available). Source: PIPSO; Insurance Information Institute (I.I.I.). 19
Florida Citizens Exposure to Loss ($ Billions) Florida Citizens’ exposure in in recent years has approach one-half trillion dollars Since its creation in 2002, total exposure to loss in Florida Citizens has increased by 163 percent, from $154.6 billion to $406 billion in 2009. * Preliminary 2009 PIPSO figures. Source: PIPSO; Insurance Information Institute (I.I.I.). 20 12/01/09 - 9pm eSlide – P6466 – The Financial Crisis and the Future of the P/C
Is Florida America’s Greece? Florida is Very Dependent on Volatile Credit Markets, Exposing the State to Instability 21
Overview of FHCF Claims-Paying Capacity Funding Sources, Assuming 100% TICL Take-Up, 2010 Heavy Reliance on Borrowing Brings Many Risks -Capacity shortfall -Credit market seizures -Interest rate spikes -Vulnerability to global systemic financial market risk -Credit risk Borrowing accounts for the majority of the FHCF’s theoretical/projected claims paying capacity. A private reinsurer would be required to have the “money in the bank” Source: Florida Hurricane Catastrophe Fund, Claims Paying Capacity, May 2010; Insurance Information Institute. 22
Bonding Capacity of the Florida Hurricane Catastrophe Fund, 10/08-5/10 ($ Billions) The financial crisis and seizure of credit markets caused bonding authority to plunge in late 2008, implying a possible funding shortfall of up to $19 billion Bonding capacity has recovered since the 2008-2009 financial crisis, but Florida’s chosen method of post-event debt financing exposes the state unnecessarily to systemic risks in the global financial system. Recent volatility suggests the risk remains. The availability of private (re)insurance was not impacted by the crisis. Source: FHCF, Raymond James; Insurance Information Institute. 23 12/01/09 - 9pm eSlide – P6466 – The Financial Crisis and the Future of the P/C
Principal and Interest Due on Existing FHCF Post-Event Tax-Exempt Debt, 2010-2016 ($ Millions) ($378.5) ($375.7) ($375.2) ($373.7) ($363.1) ($349.9) ($341.9) From 2010 through 2016, Florida homeowners, drivers and business owners will be assessed $2.6 billion ($2.15 in principal and $408.2 million in interest) to pay for debts incurred during the 2004 and 2005 hurricane season. Future storms could add to the burden. Future generations will pay for the state’s approach to insurance decades in the past. Source: Florida Hurricane Catastrophe Fund, Claims Paying Capacity, May 2010; Insurance Information Institute. 24
Florida’s Government-Run Insurers Depend Heavily on Subsidies Drivers, Business Owners and People Who Don’t Own Homes Are All Chipping In 25
State Residual Property Market Plan Deficits in 2004/2005 ($ Millions) The impact of Hurricane Katrina pushed all of the residual market property plans in the affected states into deficits for 2005, following an already record hurricane loss year in 2004. * MWUA est. deficit for 2005 comprises $545m in assessments plus $50m in federal aid. Source: Insurance Information Institute. eSlide – P6466 – The Financial Crisis and the Future of the P/C
Florida Hurricane Catastrophe Fund Assessment Base, 1990-2009 The FHCF’s assessment base is shrinking, which could result in higher future assessments in % terms Only about 25% of the FHCF’s $33.3B assessment base is associated with homeowners insurance—the rest is auto and business policies* *The FHCF’s assessment base includes all p/c lines except workers compensation, medical malpractice, accident and health and federal flood. Source: Florida Hurricane Catastrophe Fund, Claims Paying Capacity, May 2010; Insurance Information Institute. 27
Florida Citizens Property Insurance Corporation Projected 2010 Assessment Base ($ Billions) Homeowners All Other Lines Commercial Auto Lines other than Homeowners Insurance Account for 80% of Citizens Projected 2010 Assessment Base *Citizens assessment base includes all p/c lines except workers compensation, medical malpractice, accident and health and federal flood. Source: Citizens Property Insurance Corporation, Presentation to the Florida Cabinet, April 13, 2010; Insurance Information Institute. eSlide – P6466 – The Financial Crisis and the Future of the P/C
Florida Citizens: Estimated 2010 Claims-Paying Resources No assessment for a 1-in-5 year event; $8.6 million for a 1-in-25 year event Source: Citizens Property Insurance Corporation, Presentation to the Florida Cabinet, April 13, 2010; Insurance Information Institute. 29
Florida Citizens: Estimated 2010 Claims-Paying Resources Assessments 1-in-50: $2.964B 1-in-100: $10.996B Source: Citizens Property Insurance Corporation, Presentation to the Florida Cabinet, April 13, 2010; Insurance Information Institute. 30
Insurance Information Institute Online: www.iii.org Thank you for your timeand your attention! Download at www.iii.org/presentations Twitter: twitter.com/bob_hartwig