Download
1 / 16
160 likes | 224 Views
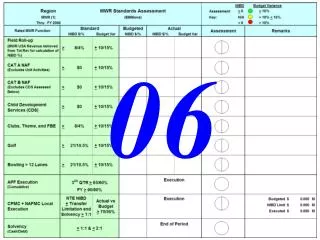
NIBD $. Budget Variance. Region. MWR Standards Assessment. <. 10%. Assessment. >. Region Budget. >. & <. N/A. > 10%. <. 15%. MWR (1). ($Millions). Key:. <. Region Budget. > 15%. Thru: FY 2011. For Internal Use Only.

E N D
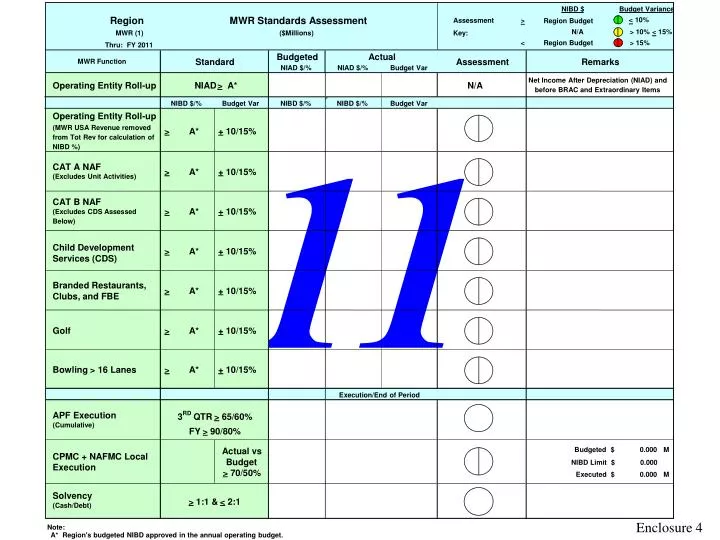
NIBD $ Budget Variance Region MWR Standards Assessment < 10% Assessment > Region Budget > . & < N/A > 10% < 15% MWR (1) ($Millions) Key: < Region Budget > 15% Thru: FY 2011 For Internal Use Only Budgeted Actual Assessment Remarks MWR Function NIAD $/% NIAD $/% Budget Var Net Income After Depreciation (NIAD) and Operating Entity Roll-up NIAD > N/A before BRAC and Extraordinary Items Budget Var NIBD $/% NIBD $/% Budget Var Operating Entity Roll-up (MWR USA Revenue removed > A* + 10/15% $0.000 $0.000 N/A from Tot Rev for calculation of R 5 NIBD %) CAT A NAF > A* + 10/15% (Excludes Unit Activities) G CAT B NAF > A* + 10/15% (Excludes CDS Assessed Below) Child Development > A* + 10/15% $0.000 Services (CDS) $0.000 Branded Restaurants, > A* + 10/15% Clubs, and FBE $0.000 Golf > A* + 10/15% $0.000 Bowling > 16 Lanes > A* + 10/15% N/A RD APF Execution 3 QTR > 65/60% (Cumulative) R 0.0% FY > 90/80% Actual vs Budgeted $ 0.000 M CPMC + NAFMC Local Budget Execution > 70/50% R R Executed $ 0.000 M Solvency > 1:1 & < 2:1 (Cash/Debt) Note: A* Region's budgeted NIBD approved in the annual operating budget. Standard A* NIBD $/% 11 Flag Flag $0.000 N/A Execution/End of Period NIBD Limit $ 0.000 Enclosure 4
G G NIBD > Budget Budget Variance < 10% A A Budget Variance > 10% and < 15% R R Budget Variance > 15% NIBD < Budget All Operating Groups Displayed on Commander’s Mission Box Standard: NIBD is greater than or equal to approved budgeted NIBD Variance is within + 10% of Budget Variances will be measured as depicted on the Commanders Mission Box N/A Enclosure 4
G G Executed* > 50% and < 70% of Budget A R R CPMC/Local Payments NAFMC Execution Standard: CPMC* and Local payments for NAFMC will not exceed NIBD at the Army-wide level. 70% of Budgeted combined payments are executed, payments executed do not exceed Region aggregate NIBD or as changed by “Plus/Minus” transfers. Executed* > 70% of CPMC Budget Execution* < NIBD** and Cash to Debt > 1:1 N/A Execution* > NIBD**, or Cash to Debt < 1:1 Executed* < 50% or > 100% of Budget , or Cash to Debt < 1:1 * Includes payments for Capital Leases ** As adjusted by transfer Enclosure 4
Solvency Standard: Cash to Debt ratio is greater than or equal to 1:1 and less than or equal to 2:1, and NIBD is positive G Cash to Debt >1:1 and < 2:1 AND NIBD > $0 Cash to Debt > 1:1 and < 2:1 and NIBD < $0, or Cash to Debt > 2:1 and < 4:1 A R Cash to Debt < 1:1 or > 4:1 Enclosure 4
NIBD $ Budget Variance Garrison Garrison MWR Standards Assessment < 10% Assessment > Garrisons Budget > . & < N/A > 10% < 15% MWR (1) ($Millions) Key: < Garrisons Budget > 15% Thru: FY 2011 For Internal Use Only Budgeted Actual Standard Assessment Remarks MWR Function NIAD $/% NIAD $/% Budget Var Net Income After Depreciation (NIAD) and Operating Entity Roll-up NIAD > $0 N/A before BRAC and Extraordinary Items NIBD $/% Budget Var NIBD $/% NIBD $/% Budget Var Operating Entity Roll-up (MWR USA Revenue removed > A* + 10/15% $0.000 $0.000 N/A from Tot Rev for calculation of R 5 NIBD %) CAT A NAF > A* + 10/15% Flag Flag (Excludes Unit Activities) G G CAT B NAF > A* + 10/15% $0.000 N/A (Excludes CDS Assessed Below) Child Development > A* + 10/15% $0.000 Services (CDS) $0.000 Branded Restaurants, > A* + 10/15% Clubs, and FBE $0.000 Golf > A* + 10/15% $0.000 $0.000 Bowling > 16 Lanes > A* + 10/15% N/A Execution/End of Period RD APF Execution 3 QTR > 65/60% (Cumulative) R 0.0% FY > 90/80% Actual vs Budgeted $ 0.000 M CPMC + NAFMC Local Budget Execution > 70/50% R R Executed $ 0.000 M Solvency Component of Single Fund > 1:1 & < 2:1 N/A (Cash/Debt) Garrison Note: A* Garrison's budgeted NIBD approved in the annual operating budget. 11 Enclosure 4
Standard: NIBD $ are greater than or equal to Region approved Budget Variance is within +10% of Budget Variance will be measured as depicted on the Commanders Mission Box NIBD NIBD • Budget < Budget Budget Variance < 10% Budget Variance > 10% and < 15% Budget Variance > 15% All Operating Groups Displayed on Commander’s Mission Box N/A Enclosure 4
G G Executed* > 50% and < 70% of Budget A R R CPMC/Local Payments NAFMC Execution Standard: CPMC*and Local Payments for NAFMC greater than or equal to 70% of Region approved Budget Executed* > 70% of CPMC Budget Executed* < 50% or > 100% of Budget * Includes payments for Capital Leases Enclosure 4
11 Enclosure 4
STANDARD: NIBD IS GREATER THAN OR EQUAL TO CPMC REQUIREMENT* BUDGET VARIANCE IS WITHIN + 10% OF BUDGET Budget Variance < 10% Budget Variance > 10% and < 15% Budget Variance > 15% NET INCOME BEFORE DEPRECIATION NIBD > CPMC Requirement* N/A NIBD < CPMC Requirement* *Value necessary in current year for long-range CPMC budget as adjusted for FY 10 service charge guidance Enclosure 4
CPMC EXECUTION STANDARD: CPMC EXECUTION EQUAL OR GREATER THAN 90% OF CPMC BUDGET EXECUTE > 90% CPMC BUDGET EXECUTE > 85% OF CPMC BUDGET, BUT < 90% CPMC BUDGET EXECUTE < 85% OF CPMC BUDGET Enclosure 4
OCCUPANCY* STANDARD: OCCUPANCY EQUAL OR GREATER THAN 80% OF AVAILABLE ROOM NIGHTS BASED ON TOTAL ROOM INVENTORY/BUDGET VARIANCE WITHIN 10% OCCUPANCY > 80% BUDGET VARIANCE +/- < 10% BUDGET VARIANCE OF +/- > 10% AND < 15% OCCUPANCY > 70%, BUT < 80% OCCUPANCY IS < 70% BUDGET VARIANCE +/- > 15% *Excluding DVQs Enclosure 4
DVQ OCCUPANCY STANDARD: OCCUPANCY EQUAL OR GREATER THAN 75% OF AVAILABLE ROOM NIGHTS BASED ON TOTAL ROOM INVENTORY/BUDGET VARIANCE WITHIN 10% OCCUPANCY > 75% BUDGET VARIANCE +/- < 10% BUDGET VARIANCE OF +/- > 10% AND < 15% OCCUPANCY > 70%, BUT < 75% OCCUPANCY IS < 70% BUDGET VARIANCE +/- > 15% Enclosure 4
G G A R R AVERAGE DAILY RATE (ADR) STANDARD: ADR IS WITHIN 10% OF THE BUDGET BUDGET VARIANCE +/- < 10% BUDGET VARIANCE OF +/- > 10% AND < 15% BUDGET VARIANCE +/- > 15% Enclosure 4
G G A R R NIBD PER OCCUPIED ROOM STANDARD: NIBD IS WITHIN 10% OF THE BUDGET BUDGET VARIANCE +/- < 10% BUDGET VARIANCE OF +/- > 10% AND < 15% BUDGET VARIANCE +/- > 15% Enclosure 4
G A R REVENUE PER OCCUPIEDROOM STANDARD: REVENUE IS WITHIN 10% OF THE BUDGET BUDGET VARIANCE +/- < 10% BUDGET VARIANCE OF +/- > 10% AND < 15% BUDGET VARIANCE +/- > 15% Enclosure 4
G A R EXPENSES PER OCCUPIED ROOM STANDARD: EXPENSES ARE WITHIN 10% OF THE BUDGET BUDGET VARIANCE +/- < 10% BUDGET VARIANCE OF +/- > 10% AND < 15% BUDGET VARIANCE +/- > 15% Enclosure 4