Download
1 / 3
30 likes | 54 Views
ANOVA is a statistical tool used for comparing statistical groups using the dependant and the independent variables. Analysis of variance (ANOVA) is a technique that uses a sample of observations to compare the number of means. ANOVA calculates statistical differences between two or more means for either groups or variances. The measured variables are called dependent variable e.g. Test score, while the variables which are controlled are termed as independent variable e.g. Test paper correction method. <br>Statswork is one among the countryu2019s leader in providing ANOVA and statistical consultancy services. Contact Statswork for availing our services.<br><br>

E N D
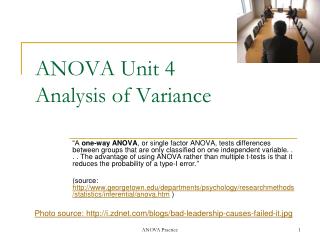
Analysis of variance (ANOVA) ANOVA is a statistical tool used for comparing statistical groups using the dependant and the independent variables. Analysis of variance (ANOVA) is a technique that uses a sample of observations to compare the number of means. ANOVA calculates statistical differences between two or more means for either groups or variances. The measured variables are called dependent variable e.g. Test score, while the variables which are controlled are termed as independent variable e.g. Test paper correction method. Statswork is one among the country’s leader in providing ANOVA and statistical consultancy services. Contact Statswork for availing our services. Analysis of variance Analysis of variance (ANOVA) is a statistical technique which is used to compare datasets. It is commonly referred as Fisher’s ANOVA or Fisher’s analysis of variance. It is similar to that of t-test and z-test, which are used to compare mean along with relative variance. However, in ANOVA, it is best suited when two or more populations/samples are compared. Researchers and students use ANOVAs according to their research needs. The three commonly used ANOVA are One-way ANOVA, Two-way ANOVA, and N-way ANOVA Different types of ANOVA: Factorial ANOVA This type of ANOVA show whether a combined independent variable can predict the value of the dependent variable. In one-way ANOVA, only a single factor is examined using the effects of different levels. Factorial ANOVA, on the other hand, allows you to understand the interactions between factors instead of requiring two different sets of experiments to determine the effects of the two factors. This ANOVA can use random numbers to design the factors. © 2019 Statswork. All Rights Reserved
One- way ANOVA One-way ANOVA compares levels of a single factor i.e. one independent variable over the dependent variable. Two- way ANOVA Two-way ANOVA is used to compare two or more factors i.e. effect of two independent variables on a single dependent variable. This can be used in understanding the interaction between the two independent variables. Both types of ANOVA have a single continuous response variable. N-way ANOVA Data classified in multiple independent variables are used in an N-way analysis of variance for example differences in age and gender can be checked simultaneously using two-way ANOVA. The N-way ANOVA can show whether there are effects of the independent variable and interactions between them. Interactions are usually seen when one independent variable depends on the second independent variable. Within-subjects ANOVA Within-subject, ANOVA are factors where the same subjects are compared under different conditions or levels. These levels can be measurements for the same size. They can also be reiterations of the same outcome over time. Mixed model ANOVA A combination of Within-unit ANOVA along with Between-unit ANOVA gives us a Mixed- unit ANOVA. It consists of at least two independent variables. One of these variables must vary with Between-unit ANOVA and one has to vary with Mixed-unit ANOVA. Omnibus ANOVA test © 2019 Statswork. All Rights Reserved
There is no significant difference in the groups which is the null hypothesis for an ANOVA. The other hypothesis states that there will be at least a single difference among the groups considered. The researcher must test the assumptions of ANOVA. After finding the data, F- ratio and the p-value must be calculated. If the p-value associated with F-ratio is smaller than 0.5 then the null hypothesis is rejected and the other hypothesis is given prominence. This means that the mean of all groups is not equal. After this, the researcher should consider doing the Post-hoc test to understand which groups are different from each other. Post- hoc test helps to identify errors and later places the items in a group. F-Tests The test is simply a ratio of two variances. Variances are a measure of how far the data is scattered. It is based on the population of the mean squares which is an estimate of the population variance. T-Test It is a test that determines whether there is a difference between the means of two groups which may have certain identical features. Mostly used in data set where flipping a coin or dice 100 times would be followed by distribution having unknown variances. It is a Hypothesis-testing tool and assumptions are tested using it. Homogeneity of variance It is an assumption where there are population variances in both T-tests as well as F-tests of two or more samples, which are equal. Welch and the Brown-Forsythe test In certain cases, the variances cannot be assumed to be equal and at this juncture, the F test of ANOVA is not suitable so this is when Welch and the Brown-Forsythe test come into effect. The test adjusts the denominator of the F ratio and it has the same expectancy of the numerator when the null hypothesis is true. © 2019 Statswork. All Rights Reserved