Download
1 / 33
330 likes | 460 Views
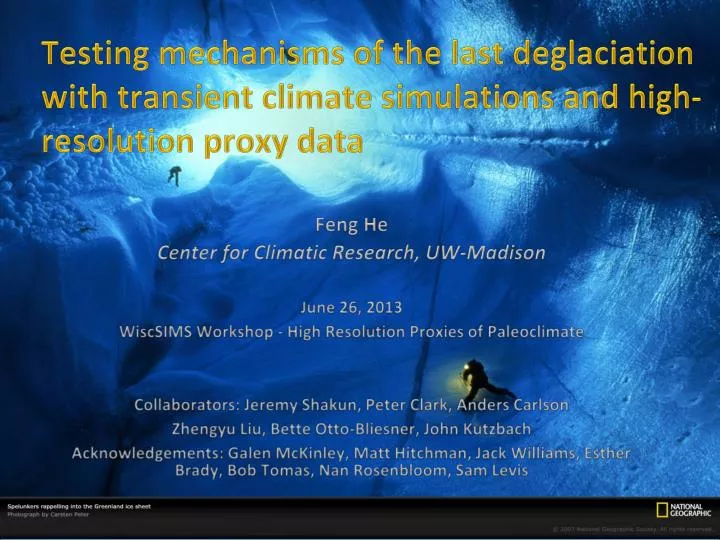
Testing mechanisms of the last deglaciation with transient climate simulations and high-resolution proxy data. Feng He Center for Climatic Research, UW-Madison June 26, 2013 WiscSIMS Workshop - High Resolution Proxies of Paleoclimate

E N D
Testing mechanisms of the last deglaciation with transient climate simulations and high-resolution proxy data Feng He Center for Climatic Research, UW-Madison June 26, 2013 WiscSIMS Workshop - High Resolution Proxies of Paleoclimate Collaborators: Jeremy Shakun, Peter Clark, Anders Carlson Zhengyu Liu, Bette Otto-Bliesner, John Kutzbach Acknowledgements: Galen McKinley, Matt Hitchman, Jack Williams, Esther Brady, Bob Tomas, Nan Rosenbloom, Sam Levis
Ice-Age Cycles Lisiecki and Raymo (2005) http://commons.wikimedia.org/wiki/File:Five_Myr_Climate_Change.png
Problem of SH-lead NH Ice SH Temp Time “Fly in the ointment”
2009 2007 SH Spring Insolation CO2-only ICE-only ORB-only
Data-model comparison: testing mechanisms of the last deglaciation IPCC-type coupled climate model High-res proxy data Loutre, M. F. (2003)
INCITE Supercomputing Support Model: CCSM3 (T31_gx3v5) + dynamic vegetation ATM 3.75(lon) x 3.75(lat) x 26(level) OCN ~3 (lon/lat) x 25 (level) Peak performance: 120 model years per day 21,000 years in 6 months Data storage: over 300 TB
TraCE simulations • Transient boundary conditions • Orbital forcing • GHGs • Ice sheets • Meltwater forcing (AMOC)
Five simulations • Simulation ALL (ORBIT+GHG+Icesheets+AMOC) • Simulation ORB (ORBIT) • Simulation GHG (GHG) • Simulation ICE (Ice sheets) • Simulation MOC (AMOC)
4 Antarctic records 13 SH SST records
TraCE simulation of the SH deglaciation Magnitude Greenland South Atlantic Indian Ocean South Pacific SH SST Antarctic Red: ALL forcing Blue: Orbital only
TraCE simulation of the SH deglaciation Timing Greenland South Atlantic Indian Ocean South Pacific SH SST Antarctic Red: ALL forcing Blue: Orbital only
Bipolar seesawearly deglacial warming in the SH(Simulation ALL vs. single forcing simulations)
bipolar seesaw (19-17 ka) Greenland SH SST Antarctic ORBIT-only ICE-only GHG-only MOC-only ALL
Deglacial CO2 rise synchronous deglacial warming and eventually reach and sustain complete deglaciation (Simulation ALL vs. single forcing simulations)
CO2-induced global warming(17-15 ka) Greenland SH SST Antarctic ORBIT-only ICE-only GHG-only MOC-only ALL
Mechanism of the terminationsWhat’s causing the deglacial CO2 rise?
NH meltwater Early warming of the Southern Oceandeglacial CO2 rise
Large NH Ice sheets at LGMNH meltwater Early warming of the Southern Oceandeglacial CO2 rise 2006