Download
1 / 39
390 likes | 501 Views
Colorado State University’s EPA-FUNDED PROGRAM ON SPACE-TIME AQUATIC RESOURCE MODELING and ANALYSIS PROGRAM (STARMAP). Jennifer A. Hoeting and N. Scott Urquhart Associate Professor and Senior Research Scientist Department of Statistics Colorado State University

E N D
Colorado State University’s EPA-FUNDED PROGRAM ONSPACE-TIME AQUATIC RESOURCEMODELING and ANALYSIS PROGRAM (STARMAP) Jennifer A. Hoeting and N. Scott Urquhart Associate Professor and Senior Research Scientist Department of Statistics Colorado State University Fort Collins, CO 80523-1877
This research is funded by U.S.EPA – Science To Achieve Results (STAR) Program Cooperative Agreement # CR - 829095 STARMAP FUNDINGSpace-Time Aquatic Resources Modeling and Analysis Program The work reported here today was developed under the STAR Research Assistance Agreement CR-829095 awarded by the U.S. Environmental Protection Agency (EPA) to Colorado State University. This presentation has not been formally reviewed by EPA. The views expressed here are solely those of presenters and STARMAP, the Program they represent. EPA does not endorse any products or commercial services mentioned in these presentation.
Overview of Presentation • EPA’s Request for Applications (RFA) • CSU’s Response = STARMAP • A summary of some of the goals and recent accomplishments of the four STARMAP projects • Opportunities for Cooperation
EPA’s REQUEST FOR APPLICATIONS(RFA) Content Requirements • Research in Statistics Directed toward using, in part, data gathered by probability surveys of the “EMAP-sort.” • Training of “future generations” of environmental statisticians • Outreach to the states and tribes
EPA’s REQUEST FOR APPLICATIONS(RFA) - continued • Major Administrative Requirement “… each of the two programs established will involve collaborative research at multiple, geographically diverse sites.” • Two Programs: • Oregon State University: Design-based/model assisted survey methodology • Colorado State University: Spatial and temporal modeling, incorporating hierarchical survey design, data analysis, modeling
RESPONSE to RFA from CSU • Institutions: • Colorado State University • Department ofStatistics • Natural Resources Ecology Lab • Oregon State University • Including work at • Iowa State University • University of Alaska, Fairbanks • University of Washington • Southern California Coastal Water Research Project (SCCWRP) • Water Quality Technology, Inc
STARMAP Overview Goals of STARMAP: • Develop statistical methods for aquatic resources • Extend current methods for sampling design and modeling • Emphasize spatio-temporal data: spatially explicit data collected over time
STARMAP Overview • Most statistical techniques taught in graduate statistics classes assume that the observations are uncorrelated • Reality: aquatic resources that are nearby in space are typically more similar than those far apart • STARMAP aims to • Develop sampling methods to enhance EMAP designs • Develop statistical methods which make the best use of the all available current data
STARMAPTypes of available data • A response of interest • A probability sample in a region, e.g., 305(b) • Some purposefully chosen points in the region • Spatially “intensive” points near some of the observation locations • Response may be multivariate • Predictors • Some at observation locations only • Some at whatever density desired from GIS
STARMAP PROJECTS • Combining Environmental Data Sets 2. Local Estimation • Indicator Development • Outreach
STARMAP PROJECT 1: COMBINING ENVIRONMENTAL DATA SETS Project leader: Jennifer Hoeting, CSU Department of Statistics Two of the goals of the project: • Develop models and methodology for modeling aquatic resource data • Enhance EMAP designs
STARMAP PROJECT 1: A closer look at one of the projects Goal 1: Develop models and methodology for modeling aquatic resource data • Challenges: • Spatially explicit, but incomplete coverage over space • Form of the response • Example: Compositional data • What proportion of the species of fish at a sample location are in three pollution (or thermal) tolerance categories: intolerant, intermediate, and tolerant? • Can we relate multiple compositions to environmental covariates in a scientifically meaningful way?
Modeling compositional data:Motivating Problem • Stream sites in the Mid-Atlantic region of the United States were visited • Response: For each site, each observed fish species was cross categorized according to several traits • Predictors: Environmental variables are also measured at each site (e.g. precipitation, chloride concentration,…) • How can we determine if collected environmental variables affect species trait compositions (which ones)?
Modeling compositional data:Sampling locations for Mid-Atlantic Highlands Region
Modeling compositional data:Discrete Compositions and Probability Models • Compositional data are multivariate observations Z = (Z1,…,ZD) subject to the constraints that SiZi = 1 and Zi 0. • Compositional data are usually modeled with the Logistic-Normal distribution (Aitchison 1986). • LN model defined for positive compositions only, Zi> 0 • Problem: With discrete counts one has a non-trivial probability of observing 0 individuals in a particular category
Modeling compositional data:Random effects discrete regression model • Developed a new model: the random effects discrete regression model • Developed Bayesian methods to estimate the parameters of this model • Developed graphical models theory which allows for statistically sound displays of the results
Modeling compositional data:Random effects discrete regression model • Sampling of individuals occurs at many different random sites, i = 1,…,S, where covariates are measured only once per site • Hierarchical model for individual probabilities:
Modeling compositional data: Example Chain Graph a b c e d • Mathematical graphs are used to illustrate complex dependence relationships in a multivariate distribution • A random vector is represented as a set of vertices, V . • Pairs of vertices are connected by directed or undirected edges depending on the nature of each pair’s association
Modeling compositional data: Fish Species Richness in the Mid-Atlantic Highlands • 91 stream sites in the Mid Atlantic region of the United States were visited in an EPA EMAP study • Responsecomposition: Observed fish species were cross-categorized according to 2 discrete variables: • Pollution tolerance • Intolerant • Intermediate • Tolerant • Habit • Column species • Benthic species
Modeling compositional data: Stream Covariates Environmentalcovariates: values were measured at each site for the following covariates • Mean watershed precipitation (m) • Minimum watershed elevation (m) • Turbidity (ln NTU) • Chloride concentration (ln meq/L) • Sulfate concentration (ln meq/L) • Watershed area (ln km2)
Precipitation Tolerance Habit Chloride Elevation Turbidity Area Sulfate Modeling compositional data: Fish Species Functional Groups Posterior suggested chain graph for independence model (lowest DIC model) Edge exclusion determined from 95% HPD intervals for b parameters and off-diagonal elements of Ø.
Modeling compositional data:A summary The Random Effects Discrete Regression Model • Allows for multivariate composition response • Provides a statistically defensible graphical model interpretation • Offers measures of uncertainty and inferences not available using other techniques for species trait and related analyses • Allows for predictions at unobserved locations
STARMAP PROJECT 1: Some Recent Accomplishments Goal 1: Develop models and methodology for modeling aquatic resource data Other projects aimed at goal 1: • Models for radio telemetry habitat association data • Radio-tagged fish are monitored over time • Goal: extend existing models to account for seasonal changes in fish habitat types • Model selection for geo-statistical models • When predicting a continuous response , which covariates are best? • Does spatial correlation affect model selection (YES!)
STARMAP PROJECT 1: Some Recent Accomplishments Goal 2: Enhance EMAP designs • How should EMAP-type sampling be intensified to estimate spatial correlation? • Current context – City of San Diego and Southern California Coastal Water Research Project (SCCWRP) • Accurate maps of environmental measures around San Diego’s oceanic sewage outfall • How to Get From 305(b) Survey Results to Identify 303(d) Sites? • STARMAP organized a morning of talks on this topic at the recent EMAP Conference
STARMAP PROJECT 2: Local Inferences from Aquatic Studies Project leader: Jay Breidt, CSU Department of Statistics Goals: • Develop techniques for small area estimation • Develop methods to estimate the cumulative distribution function • Methods to infer causality from non-experimental spatially referenced data
STARMAP PROJECT 2: Some Recent Accomplishments Goal 1: Small area estimation • Combining probability survey data with non-probability data to make spatially-explicit predictions • Bayesian models to construct a set of ensemble estimates to predict some response • Data not observed everywhere, but methods will provide predictions over entire region along with estimates of uncertainty • Current emphasis: characteristics of water quality for Mid-Atlantic Highlands region
STARMAP PROJECT 2: Some Recent Accomplishments • Goal 1: Developing and comparing different methods for small area estimation • Developing new semi-parametric methods • Compared to parametric and non-parametric methods, can optimize over the benefits of both • Goal 2: Nonparametric regression estimators for two-stage samples • Incorporates auxiliary information available at the level of the primary sampling unit • Current emphasis: EMAP Northeast Lakes • Presented results at recent EMAP conference
STARMAP PROJECT 3: Development and Evaluation of Aquatic Indicators Project leader: Dave Theobald, CSU Natural Resources Ecology Lab Two of the project goals: • Develop and determine landscape indicators for analyses of EMAP data • Develop better GIS tools for relevant agencies
STARMAP PROJECT 3: Some Recent Accomplishments Goal 1: Develop and determine landscape indicators for analyses of EMAP data • Developing predictors for stream size and flow status to overcome limitations of the National Hydrological Database • Classification of perennial versus non-perennial streams • Estimation of regional indicators of taxa richness • Quantifying taxa richness in terms of rarity assessed by a fixed count • Sampling macroinvertebrates: compositing and structure of variance • Compiling indicators and additional GIS data coverage for MAHA and Western Pilot Study
STARMAP PROJECT 3: Some Recent Accomplishments Goals 2: Develop better GIS tools • Software for Generalized Random Tessellation Stratified (GRTS) sampling • GRTS: Robust spatially balanced random sampling • Software implements the GRTS algorithm in ARCVIEW • Software is in final testing stages
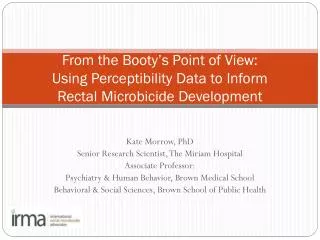
Photo interpretation points displayed with predicted current condition map
STARMAP PROJECT 4: OUTREACH Project leader: Scott Urquhart, CSU Department of Statistics Project goals: • Identify and establish statistical needs of states, tribes and local agencies • Prepare content material relevant to target audience
STARMAP PROJECT 4: Outreach • Learning Materials for Aquatic Monitoring • Individualized interface • Images can vary by geographic context • Content varies by responsibility level • Supports language variation • Browser based • Also available on a CD ROM • Avoid internet delays for learners at remote sites & in the field • Customizable environment • Materials are under active development • Interface & initial materials tested late last summer by monitoring personnel in state agencies, Region 10 and NGOs • Anticipate video taping of EMAP training session in Corvallis later this month; material to be included in “How to Monitor” • See poster and reprint for more info
STARMAP PROJECT 4: Recent Accomplishments • Content – • Monitoring Objectives • Methods for Site Selection • What/How to Monitor • How to Monitor = Field Operations • How to Summarize • Case Studies • Planning studies • Site selection • Analyses
STARMAPTraining future environmental statisticians • Graduate students graduated • 1 Ph.D. + 1 affiliated student in landscape ecology • 4 M.S. • Current graduate students • 6 Ph.D. students – including two in landscape ecology • 2 M.S. students • Post doctoral fellows – one at present; seeking others • Early career professionals • 3 young faculty • 2 agency employees
STARMAPTraining future environmental statisticians Colorado State University’s PRIMES program • PRogram for Interdisciplinary Mathematics, Ecology and Statistics, • NSF IGERT program aimed at training graduate students in this interdisciplinary area • Works well with STARMAP as both have similar goals • Allows us to offer new classes and support students in many ways • Opportunities for visitors and joint research!
OPPORTUNITIES FOR COOPERATION • GIS-based GRTS site selection • New analysis needs • We are looking for aquatic environmental data sets • Which are spatially intense • Like at sites 100s of meters apart to few km • Or which include spatial locations and were collected over a long time frame (> 5 time points) • Identified several such possible sets at EMAP Conference • Involvement in Evolving Learning Materials • Testing • Suggestions • Case studies • We could analyze some data for you to make these
CHECK OUT WHAT WE ARE DOING • STARMAP Web Site: • http://www.stat.colostate.edu/starmap/ • This presentation will be posted there, soon. • Team members here are … • Questions Are Welcome!