
Analysis of Laser Light Propagation in Maritime Environments
This research aims to minimize light fluctuations and intensity losses when propagating laser beams in maritime settings. Experiments utilized Gaussian and Bessel beams to assess their impact on a light intensity sensor (CCD camera) over 108 trials. Results indicated statistical variance in intensity, particularly in correlation widths when measuring beam distributions. MATLAB analyses illustrate temporal intensity variations and maximum intensity locations. Continued investigation is recommended to enhance laser light stability and reliability, paving the way for effective applications in maritime technologies.

Analysis of Laser Light Propagation in Maritime Environments
E N D
Presentation Transcript
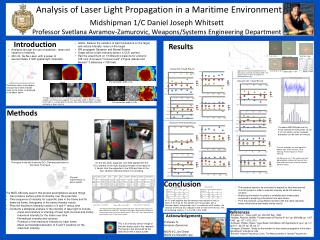
Analysis of Laser Light Propagation in a Maritime Environment Midshipman 1/C Daniel Joseph Whitsett Professor Svetlana Avramov-Zamurovic, Weapons/Systems Engineering Department Introduction Results • GOAL: Reduce the variation of light fluctuations on the target and reduce intensity loses on the target • Will propagate Gaussian and Bessel Beams • Target will be a light intensity sensor, a CCD camera • Ran the experiment on 13 different occasions for a total of 108 runs (6 screens *3 screen sets* 2 Types (Gauss and Bessel)* 3 distances = 108 trials • Analyzed through the use of statistics - mean and variance of intensity • 630 nm, He-Ne Laser, with a power of approximately 2 mW, spatial light modulator Beta 5 D=5m SLM 16 D=10m Beta 1 D=10 Bessel Set 2 Quad Results Beta 0.45 D=10m Approximate relationship between Bessel Beta values and SLM Correlation Width. The specific values used in this project are tabulated to the right. Beta 0.25 D = 5m Gaussian Set 1 Quad Results The correlation width is 16. Black Scintillation refers to the degree and quantity of dark and light spots on the target, as displayed in the above figure. The figure above to the left is a picture of the laser and the picture in the middle is the SLM screen applied. The correlation width is 4096. The figure to the right is a surface plot of intensity. Dark red indicated higher intensity while blue is lower intensity. The correlation width is 128. Methods Gaussian Set 3 Quad Results The above MATLAB plots are the frame intensity for SLM screen 16, set 3, at 100 meters. A clear unimodal distribution can be seen for intensity. Expander He-Ne Laser The sets of quads are from top left to bottom right, Pixel Variance, Pixel Intensity, Frame Variance, Frame Intensity. For Gaussian set 1, the results are from top to bottom variance of intensity for a pixel and then frame, intensity for pixel and then frame. The figure to the left shows the DCx Camera positioned on the tripod. The figure On the left, laser, expander, and SLM aligned with the DCx camera, to the right, displays the path of the laser as it travels from the expander to the SLM and then to the DCx camera (intensity sensor) for recording. Physical representation of beam wander. Conclusion • The research needs to be continued to expand on what was learned from this project in order to maintain intensity while still reducing variance • Analyzing information for pixels is unreliable and unnecessary compared to analyzing information from each frame • From the research, using different screens with the same statistical values will produce statistically similar results. Bessel Beams Gaussian Beams • The MATLAB code used in this project accomplishes several things • Can produce surface plots of intensity over the pixel field • Time sequence of intensity for a specific pixel in the frame and for frame by frame, histograms of the same intensity values • Plots the maximum intensity location in X and Y versus time • Conducts a statistical analysis of the intensity of laser light to include • -mean and variance of intensity of laser light (for pixel and frame) • -maximum intensity for the frame over time • -Normalized intensity and variance • -Positions of the maximum intensity for each frame • -Mean and standard deviation of X and Y locations for the hhhhhhhhmaximum intensity An “X” mark signifies that the variance was reduced in half, or more, of the trials for that specific set. For example, with a Gaussian beam, using screen set 1, at a distance of 50 meters, the variance of intensity was reduced in half or more of the 6 trials. The 6 trials being screens, 1, 4, 16,128, 1024, 4096. Gauss 50 m set 2 SLM 4 Gauss 50 m set 3 SLM 128 Gauss 100 m set 3 SLM 16 The above and the data table accompanying them, represent the measure of beam wander for three trials. The dots in the graphs show the pixel location of the maximum intensity for one specific frame. The X and Y axes represent the pixel and the z axis is the frame number. References Acknowledgements -Schawlow, A., “Laser Light” pp. 282-290 Sep. 1968 -Halliday; Resnick; Walker “Fundamentals of Physics 9th ed.” pp. 889-896, pp. 1057-1062, pp. 1071-1072, 2011 -Andrews; Phillips; Hopen “Laser Beam Scintillation with Applications” pp.2, pp. 5-7, pp.8-11, pp. 29, pp. 34, pp. 37 -Hongyan; Zhensen, “Study on the wander for laser beam propagation in the slant atmospheric turbulence” pp4 -Bernard, Optical Frequency Comb, The Measurement of Optical Frequencies Professor S. Avramov-Zamurovic MIDN 4/C Joe Dinkel MIDN 4/C Meredith Lipp This is an intensity sensor image of the laser being used in this research. The figure to the left would be the ideal result with a black screen


