Synchronous Counter Design Process
140 likes | 313 Views
Learn how to design synchronous counters step-by-step using state diagrams, next-state tables, flip-flop transition tables, Karnaugh maps, and logic expressions. Implement a 3-bit Gray code counter following the detailed instructions.

Synchronous Counter Design Process
E N D
Presentation Transcript
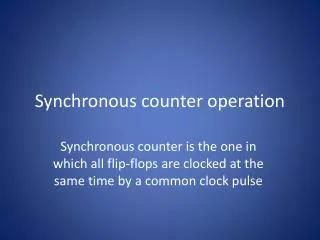
Synchronous Counter Design Most requirements for synchronous counters can be met with available ICs. In cases where a special sequence is needed, you can apply a step-by-step design process. The steps in design are described in detail in the text and lab manual. Start with the desired sequence and draw a state diagram and next-state table. The gray code sequence from the text is illustrated:
Step 1: State Diagram The first step in the design of a counter is to create a state diagram. A state diagram shows the progression of states through which the counter advances when it is clocked. As an example, is a state diagram for a basic 3-bit Gray code counter. This particular circuit has no inputs other than the clock and no outputs other than the outputs taken off each flip-flop in the counter. You may wish to review the coverage of the Gray code in at this time. Step 2: Next-State Table Once the sequential circuit is defined by a state diagram. the second step is to derive a next- state table, which lists each state of the counter (present state) along with the corresponding next state. The next state is the state that the counter goes to from its present State upon application of a clock pulse The next-state table is derived from the state diagram and is shown in Table for the 3-bit Gray code counter. Qo is the least significant bit.
Next state table: Step 3: Flip-Flop Transition Table Table above is a transition table for the J-K flip-flop. All possible output transitions are listed by showing the Q output of the flip-flop going from present states to next states. QN is the present state of the flip-flop (before d clock pulse) and QN + I is the next state (after a clock pulse). For each output transition. the 1 and K inputs that will cause the transition to occur are listed. An X indicates a "don't care" (the input can be either a I or a 0).
To design the counter, the transition table is applied to each of the flip-flops in the counter, based on the next-state table (Table 8-7). For example, for the present state 000, Qo goes from a present state of 0 to a next state of 1. To make this happen, 10 must be a I and you don't care what Ko is (jo = I, Ko = X), as you can see in the transition table. Next, QI is 0 in the present state and remains a 0 in the next state. For this transition, 1 1 = 0 and K, = X. Finally, Q2 is 0 in the present state and remains a 0 in the next state. Therefore, 1 2 = 0 and K 2 = X. This analysis is repeated for each present state in Table Step 4: Karnaugh Maps Karnaugh maps can be used to determine the logic required for the 1 and K inputs of each flip-flop in the counter. There is a Karnaugh map for the 1 input and a Kamaugh map for the K input of each flip-flop. In this design procedure, each cell in a Kamaugh map represents one of the present states in the counter sequence listed in Table 8-7. From the 1 and K states in the transition table (Table 8-8) a 1,0, or X is entered into each present state cell on the maps depending on the transition of the Q output for a particular flip- flop. To illustrate this procedure, two sample entries are shown for the 10 and the Ko inputs to the least significant flip-flop (Qo)
Step 5: logic Expressions for Flip-Flop Inputs From the Karnaugh maps you obtain the following expressions for the 1 and K inputs of each flip-flop: Step 6: Counter Implementation The final step is to implement the combinational logic from the expressions for the 1 and K inputs and connect the flip-flops to form the complete 3-bit Gray code counter as shown .
1. Specify the counter sequence and draw a state diagram. 2. Derive a next-state table from the state diagram. 3. Develop a transition table showing the flip-flop inputs required for each transition. The transition table is always the same for a given type of flip-flop. 4. Transfer the 1 and K states from the transition table to Karnaugh maps. There is a Karnaugh map for each input of each flip-flop. 5. Group the Karnaugh map cells to generate and derive the logic expression for each flip-flop input. 6. ÷mplement the expressions with combinational logic. and combine with the flip- flops to create the counter.
Design a counter with the count sequence shown in the state diagram of the following figure . Use J-K flip-flops. Solution Step 1: The state diagram is as shown. Although there are only four states, a 3-bit counter is required to implement this sequence because the maximum binary count is seven. Since the required sequence dues not include all the possible binary states, the invalid states (0, 3,4, and 6) can be treated as "don't cares" in the design. However, if the counter should erroneollsly get into an invalid state, you must make sure that it goes back to a valid state. Step 2: The next-state table is developed from the state diagram and is given in the following table.
Step 3: The transition table for the J-K flip-flop is repeated in Step 4: The J and K inputs are plotted on the present-state Karnaugh maps in Figure . . Also "don't cares" can be placed in the cells corresponding to the invalid states of 000, 011, 100, and 110, as indicated by the red Xs.
Step 5: Group the 1 s, taking advantage of as many of the "don't care" states as possible for maximum simplification. Notice that when all cells in a map are grouped, the expression is simply equal to I. The expression for each J and K input taken from the maps is as follows: Step 6: The implementation of the counter is shown