Download

1 / 42
420 likes | 639 Views
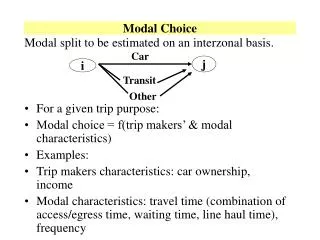
Discrete Choice Models for Modal Split. Overview. Outline. General procedure for model application Basic assumptions in Random Utility Model Uncertainty in choice Utility & Logit model Numerical example Application issues in four step model Summary. Individual & Travel Data.

E N D
Outline • General procedure for model application • Basic assumptions in Random Utility Model • Uncertainty in choice • Utility & Logit model • Numerical example • Application issues in four step model • Summary
Individual & Travel Data Predict Exogenous Explanatory & Policy Variables Choice Model Formulation Estimate Dissagregate Choice Model(s) Aggregate (TAZ) Travel Prediction Apply Prediction Procedure Insert Predicted Proportions for Each Mode in the Four Step Sequence
Theory from microeconomics • We will skip the more theoretical description of principles, theorems, lemas • Emphasize practical aspects • Look at examples • Note: Dan McFadden is Professor of Economicsand Nobel Laureate in Economicshttp://emlab.berkeley.edu/users/mcfadden/ • A site that contains a very good bibliography on Random Utility Models
Basic Assumptions (1) • Suppose a trip maker i faces J options (choices or alternatives) with index j=1,2,3…J. • Assume that each trip maker associates with each choice j=1,2,...,J a function called UTILITY representing the "convenience" of choosing mode j. • j=1,2,..., J is called the choice set. This is the set from which a decision maker chooses an option. • Note: Let’s assume that choice and consideration sets are the same.
Basic Assumptions Example • A person, i, needs to go to work from home to the downtown area. • Suppose this person has three possible modes to choose from: Car (j=1), Bus (j=2), and her Bike (j=3). Total number of options (J=3). • One possible form of the person’s convenience function (called utility) is: Ucar=F (car attributes, person characteristics, trip attributes) Ubus=F (bus attributes, person characteristics, trip attributes) Ubike=F (bike attributes, person characteristics, trip attributes)
Utility components • Variables describing the individual --> this is an attempt to represent "taste variation" from person to person. In our example if young persons have systematically differing preferences from the older individuals, then, age would be one of the variables. • Variables describing the choice characteristics (called choice attributes) in the choice set. For example, some travel modes are less expensive than others. Cost of the trip for each available mode would be another variable in the utility. Travel time is another key variable. • Variables describing the context such as the trip type, time of day, budget constraints.
Key Assumption (maximum utility) • Travelers (decision makers) formulate for each option a utility and they calculate its value. • Then, they choose the option with the most advantageous utility (maximum utility). • Example: U(car,bus,bike)=-0.5*cost-2*waiting time • Cost by bus=$1, Waiting time=5 minutes • Cost by car=$2.5, Waiting time=1 minute • Cost by bike=$0.2, Waiting time=0 minutes Which mode is the most desirable, second less desirable, etc? Utility is actually an Indirect Conditional Utility
Uncertainty in utility (1) • We (analysts) do not know all the factors that influence choice behavior • Travelers (decision makers) do not always make choices consistently • We are not interested in including all possible variables that affect behavior in our models • We are interested in policy variables (taxes, fares, gasoline costs, waiting times) that we can “manipulate” to find travelers reaction • We are also interested in social, demographic, and economic traveler characteristics because these variables allow us to link models to TAZs
Incorporating uncertainty and traveler/trip characteristics • The example becomes: U(bus,car,bike)=-0.5*cost-2*waiting time + SOMETHING ELSE • The “something else” is an indicator of “general mode attractiveness” AND a random component • Let’s look at the details:
Utility elements • Uij = aj-0.5*costj-2*waiting timej + bj * agei + eij Utility of person i for mode j
Utility elements A constant for each mode j. Captures desirability of j for unknown reasons • Uij = aj-0.5*costj-2*waiting timej + bj * agei + eij
Utility elements Cost is different for each mode j • Uij = aj-0.5*costj-2*waiting timej + bj * agei + eij Waiting time is different for each mode j
Utility elements • Uij = aj-0.5*costj-2*waiting timej + bj * agei + eij The effect of the age variable is different for each alternate mode (Class: Let’s talk about behavioral meaning - bikes?)
Utility elements • Uij = aj-0.5*costj-2*waiting timej + bj * agei + eij The key indicator of uncertainty = our ignorance & traveler variability for unknown reasons
Utility elements • In a similar way as for age we can include other traveler and trip characteristics (explanatory) • Uij = aj-0.5*costj-2*waiting timej + bj * agei + eij In applications: These are parameters we estimate from data using regression methods
Utility elements • Uij = aj-0.5*costj-2*waiting timej + bj * agei + eij • Can write as: Uij = Vjj + eij Random Systematic & measurable part
Numerical example(trip from home to work/school) • Uicar = 6 - 0.5*cost- 2*waiting time + 0.15 * agei + eicar • Uibus = 5 - 0.5*cost- 2*waiting time + 0.25 * agei + eibus • Uibike = 12 - 0.5*cost- 2*waiting time - 0.3 * agei + eibike Note: Different age coefficients - why?
Compare systematic part (V) • Compute for each person the systematic part of utility for each mode • Plot all V (syst. utilities) for all persons • Horizontal = age • Vertical = V the systematic part of utility of each mode
Probability of Choice • We need to convert utilities to an estimate of the chance to choose a mode • The specific equation to use depends on the probability distribution of the random component (e) in the utility function (U=V+e) • Ease of calculations should be considered in selecting a probability function
LOGIT Model • Assume the random components (ei) of the utility are independent identically Gumbel distributed random variables then:
Applications • Modal split (type of mode) • Route choice (link by link or entire path) • Car ownership (type of car) • Destination choice (shopping place) • Activity types (type of activity) • Residential unit (size and type of home)
Practical issues • Choice set - consideration set • Variables to include in utility • Measurement of mode attributes (e.g.,in-vehicle-travel-time) • Need survey data and mode by mode attributes! • Next: TAZ application and “complete” enumeration
Individual & Travel Data Predict Exogenous Explanatory & Policy Variables Choice Model Formulation Estimate Dissagregate Choice Model(s) Aggregate (TAZ) Travel Prediction Apply Prediction Procedure Insert in the Four Step Sequence
For the four step modal split • We need aggregate TAZ proportions by each mode (% of trips by car, % trips by bus, % trips by bike) • We have a disaggregate (individual) model which tells us the likelihood (chance) of a person to choose each mode • We need a procedure to go from disaggregate predictions of chance to aggregate predictions of proportions
Taking Average TAZ Characteristics Does Not Work • (Pa+Pb)/2 is not the same as P ([Va+Vb]/2) - a and b are value points for V • When the two are equated we have the Naïve method of aggregation • Bias depends on how close the probability function is to a linear function • Following is an example from Probability to choose bus as an option
Consider a TAZ with two persons with V=2 &V=12 P(V=12)=0.679 P(V=2)=0.034 V=2 V=12
What is the correct TAZ Proportion of Choosing the Bus? • (P(V=2)+P(V=12))/2 • or • P((2+12)/2)=P(V=7)
The correct value is: [P(V=2)+P(V=12)]/2=0.357 P(V=12)=0.679 P(V=7)=0.223 P(V=2)=0.034 V=2 V=7 V=12
[P(V=2)+P(V=12)]/2=0.357 Bias (see page 310 OW) P(V=7)=0.223 V=2 V=7 V=12
Naïve Aggregation • For each TAZ take the average value of explanatory variables • Compute average value for each utility function for each mode • Compute the corresponding probability and use it as the TAZ proportion choosing each mode
Market Segmenation • Divide the residents in each TAZ into relatively homogeneous segments • Apply Naïve aggregation to each segment and get proportions for each mode • Compute the TAZ proportion either as average segment-specific proportion or weighted segment-specific proportion
Complete Enumeration • Compute for each person and for each mode the probability to choose a mode • Compute the proportion for each mode as an average of the individual probabilities • Stochastic microsimulation is a method derived from this - see also Chapter 12 of Goulias, 2003 (red book)
Example (TAZ with four persons) Vicar = 6 - 0.5*cost- 2*waiting time + 0.15 * agei Vibus = 5 - 0.5*cost- 2*waiting time + 0.25 * agei Vibike = 12 - 0.5*cost- 2*waiting time - 0.3 * agei
Theoretical issues • Gumbel IID convenient but is it realistic? • IID components imply unrelated options in the unobserved components - new models account for relations • Trips are related - different formulations • See CE 523
Additional sources • http://www.bts.gov/ntl/DOCS/SICM.html (Spear’s report on how to apply models) • http://www.bts.gov/ntl/DOCS/UT.html (self-instructional overview with examples) • http://www.tfhrc.gov///////safety/pedbike/vol2/sec2.5.htm (simple description of most of the key issues) • All sites accessed September 22, 2003
Summary • Rational economic behavior • Utility linear in systematic and random components • Choice probability is function of utilities – non linear function! • Application by enumeration is best - weighted average by market segments may be good - depends on application! • Aggregate models are also available – approximate! • Surveys must be used for this step
Additional reading suggestions(for future reference) • Ortuzar Willumsen - Chapter 8 (8.1, 8.2, 8.3) • Ortuzar Willumsen - Chapter 9 (9.1, 9.2, 9.3)