Download

1 / 7
70 likes | 157 Views
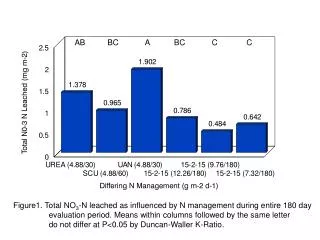
This study analyzes the effects of various nitrogen management practices on nitrate leaching, plant N uptake, dry matter accumulation, and visual quality rating over a 180-day evaluation period. The data reveals significant differences in nutrient behavior based on N sources and application methods.

E N D
AB BC A BC C C Figure1. Total NO3-N leached as influenced by N management during entire 180 day evaluation period. Means within columns followed by the same letter do not differ at P<0.05 by Duncan-Waller K-Ratio.
A A A A A A Figure 2. Percentage of applied N leached as NO3-N as influenced by N management over 180 day period. Means within columns followed by the same letter do not differ at P<0.05 by Duncan-Waller K-Ratio
Figure 3. Percentage of applied NO3-N leached as influenced by N management and month over 180 day evaluation period.
A A A A A A Figure 4. Influence of N source on mean dry matter accumulation over 180 day evaluation period. Means within a column followed by the same letter do not differ at P<0.05 by Duncan-Waller K-Ratio.
A AB A AB AB B Figure 5. Influence of N source on total N uptake during 180 day evaluation period. Means within a column followed by the same letter do not differ at P<0.05 by Duncan-Waller K Ratio.
A B A B B B Figure 6. Influence of N source on tissue N concentration 180 days after treatment application. Means within columns followed by the same letter do not differ at P<0.05 by Duncan-Waller K Ratio.
Figure 7. Influence of N source on mean visual quality rating over 180 day evaluation period. Means within a column followed by the same letter do not differ at P<0.05 by Duncan-Waller K Ratio.