Download
1 / 17
170 likes | 193 Views
Learn how to represent all possible outcomes for compound events using tables, grids, and tree diagrams. Understand the theoretical probability of each outcome.

E N D
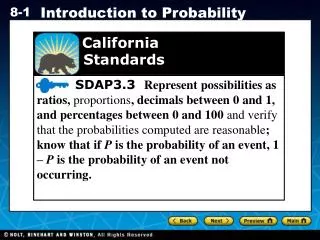
California Standards SDAP3.1 Represent all possible outcomes for compound events in an organized way (e.g., tables, grids, tree diagrams) and express the theoretical probability of each outcome. Also covered:SDAP3.3
Vocabulary sample space compound event Fundamental Counting Principle
Together, all the possible outcomes of an experiment make up the sample space. For example, when you toss a coin, the sample space is landing on heads or tails. A compound event includes two or more simple events. Tossing one coin is a simple event; tossing two coins is a compound event. You can make a table to show all possible outcomes of an experiment involving a compound event.
Additional Example 1: Using a Table to Find a Sample Space One bag has a red tile, a blue tile, and a green tile. A second bag has a red tile and a blue tile. Vincent draws one tile from each bag. Use a table to find all the possible outcomes. What is the theoretical probability of each outcome?
Additional Example 1 Continued Let R = red tile, B = blue tile, and G = green tile. Record each possible outcome. RR: 2 red tiles RB: 1 red, 1 blue tile BR: 1 blue, 1 red tile BB: 2 blue tiles GR: 1 green, 1 red tile GB: 1 green, 1 blue tile
1 6 1 6 1 3 1 6 1 6 P(2 red tiles) = P(1 red, 1 blue tile) = P(2 blue tiles) = P(1 green, 1 red tile) = P(1 green, 1 blue tile) = Additional Example 1 Continued Find the probability of each outcome.
Check It Out! Example 1 Darren has two bags of marbles. One has a green marble and a red marble. The second bag has a blue and a red marble. Darren draws one marble from each bag. Use a table to find all the possible outcomes. What is the theoretical probability of each outcome?
Check It Out! Example 1 Continued Let R = red marble, B = blue marble, and G = green marble. Record each possible outcome. GB: 1 green, 1 blue marble GR: 1 green, 1 red marble RB: 1 red, 1 blue marble RR: 2 red marbles
1 4 1 4 1 4 1 4 P(1 green, 1 blue marble) = P(1 red, 1 blue marble) = P(2 red marbles) = P(1 green, 1 red marble) = Check It Out! Example 1 Continued Find the probability of each outcome.
When the number of possible outcomes of an experiment increases, it may be easier to track all the possible outcomes on a tree diagram.
Additional Example 2: Using a Tree Diagram to Find a Sample Space There are 4 cards and 2 tiles in a board game. The cards are labeled N, S, E, and W. The tiles are numbered 1 and 2. A player randomly selects one card and one tile. Use a tree diagram to find all the possible outcomes. What is the probability that the player will select the E card and the 2 card? Make a tree diagram to show the sample space.
number of ways the event can occur total number of equally likely outcomes P(E and 2 card) = 1 8 = 1 8 The probability that the player will select the E and 2 card is . Additional Example 2 Continued List each letter on the cards. Then list each number on the tiles. S W E N 1 2 1 2 1 2 1 2 S1 S2 W1 W2 E1 E2 N1 N2 There are eight possible outcomes in the sample space.
Check It Out! Example 2 There are 3 cubes and 2 marbles in a board game. The cubes are numbered 1, 2, and 3. The marbles are pink and green. A player randomly selects one cube and one marble. Use a tree diagram to find all the possible outcomes. What is the probability that the player will select the cube numbered 1 and the green marble? Make a tree diagram to show the sample space.
number of ways the event can occur total number of equally likely outcomes P(1 and green) = 1 6 = The probability that the player will select the cube numbered 1 and the green marble is . 1 6 Check It Out! Example 2 Continued List each number on the cubes. Then list each color of the marbles. 3 2 1 Pink Green Pink Green Pink Green 3P 3G 2P 2G 1P 1G There are six possible outcomes in the sample space.
The Fundamental Counting Principle states that you can find the total number of outcomes for a compound event by multiplying the number of outcomes for each simple event.
Additional Example 3: Recreation Application Carrie rolls two 1–6 number cubes. How many outcomes are possible? The first number cube has 6 outcomes. List the number of outcomes for each simple event. The second number cube has 6 outcomes Use the Fundamental Counting Principle. 6 · 6 = 36 There are 36 possible outcomes when Carrie rolls two number cubes.
Check It Out! Example 3 A sandwich shop offers wheat, white, and sourdough bread. The choices of sandwich meat are ham, turkey, and roast beef. How many different one-meat sandwiches could you order? There are 3 choices for bread. List the number of outcomes for each simple event. There are 3 choices for meat. Use the Fundamental Counting Principle. 3 · 3 = 9 There are 9 possible outcomes for sandwiches.