Download
1 / 16
160 likes | 310 Views
Front Range CFLRP May 10, 2011. Peter Brown, PhD and Jessica Clement, PhD. General CFLRP Monitoring Plan Process As of April 5, 2011 Black: Proposed Next Steps. Step 1. Step 2. Step 3. Step 4. Step ( 5 ). Step ( 6 ). Step ( 7 ). Implement-ation: How to measure, when, by whom, where.

E N D
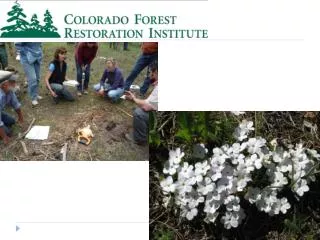
Front Range CFLRPMay 10, 2011 Peter Brown, PhD and Jessica Clement, PhD
General CFLRP Monitoring Plan Process As of April 5, 2011 Black: Proposed Next Steps Step 1 Step 2 Step 3 Step 4 Step (5) Step (6) Step (7) Implement-ation: How to measure, when, by whom, where. Reporting April Create Adaptive Manage-ment Feedback Loops Finalize Ecol. Plan protocols Social and Econ. Monitoring May Gain common understand-ing of the Science and Project Objectives Boulder Ranger District Field Trips. November 5 Gain common understanding of Science and Restoration Objectives December 14 Determine Variables: What do we measure to track change? January USFS Info Group 1: Process Group 2: Project Objectives March 4 – include FRRT February/March Release Draft Plan by May 31 Comments back by June 12, Final Plan June 17. Field trips June 15 and 29? June
FRRT Monitoring Working Group Chronology • 15 Oct: Kick-Off in Boulder: established process, reviewed restoration language, initial meeting dates, purpose of Front Range CFLRP, CFRI’s role and role of MWG. • 5 November – Discussion re. CFLRP objectives and ecological science. Presentations Tom Veblen and Tanya Schoennagel. Field trip Boulder Open Space and Taylor Mountain. • 14 December – Discussion re. collaboration (Jessica) and Project Objectives (Peter) and possible variables to measure. Agreed on decision-making method (thumbs). Break-out groups explored project objectives. Generally proposal language accepted.
FRRT Monitoring Working Group Chronology 24 January – Discussion and presentations regarding wildlife (Ken), a case study from the Uncompahgre Plateau (Pam Motley) and Peter’s core variables proposal. Break-out groups to explore possible ecological variables. Jessica proposes and group agrees that USFS present their info in Feb and metrics and process teams for March. 16 February – Received in-depth info from USFS re. CSE protocols, budgets, staffing, silvicultural and other info. Split into process and metrics group to plan March work. 4 March – FRRT Quarterly meeting: Received general support. 8 March – Process group met in Golden.
FRRT Monitoring Working Group Chronology 11 March – Metrics Team Meeting: creation of spreadsheet based on literature review, agreed to interview guide and team methodology. 31 March – Reviewed expert interview results. This translates into evidence-based restoration: use review of literature and expertise to create projects, monitoring using adaptive management. 5 April – Full MWG: review and agree to outcomes of metrics and process groups. Identified Tier 1 and Tier 2 ecological monitoring variables. Jessica introduced social and economic monitoring varaibles based on CFLRA legislation and existing CFLR protocols.
FRRT Monitoring Working Group Chronology • 27 April – Full MWG: combine Hal and Peters’ charts into BFT. BFT is chart with full ecological monitoring protocol system: desired conditions, parameters, metrics, methods and other info. Jonas presented suggestion for a sampling method that combines CSE and transect protocols to collect plot and spatial data.
Today’s Objectives • Finalize Ecological Monitoring Plan protocols (BFT) and draft outline. • Adaptive Management Discussion: where to insert data into FRRT SM Team process? • Propose process for completion of social and economic monitoring. Create short-term social and economic monitoring team for one meeting in May. Future: • Draft Proposal complete by May 31. • Release Plan June 17.
Draft Outline for Monitoring Plan • Introduction: socio-political and geographic contexts. • Summary CFLRP proposal. • Collaborative Process Description. • Scientific grounding: summary of literature and scientific experts’ contributions. • Ecological Monitoring protocols: BFT, plot scale and landscape scale sampling methods, implementation protocols. • Social/Economic Monitoring protocols: Variables collaboratively decided on, Social-Economic Team’s suggestions for monitoring plan. • References.
Each “tally” tree in the plot represents 10 or 20 ft2/ac depending on the BAF. In this case, seven trees are in the plot.
Stem Map Legend Transect 4 Transect 5 Transect 3 Transect 6 Seedlings & Saplings (VSS 1) Meadows & Inter-space Small Poles (VSS 2) Black jack (VSS 3) Yellow Pine (VSS 4) USFS Common Stand Exam Point Transect 2 Openings & structure transect Acre delineation Transect 7 Transect 1
Guide to using monitoring protocol • The transect explained • What is it? • The transect is a classic line-intercept that is most commonly used in range inventories. Lee Kaiser, Dec. of 1983, journal Biometrics, does a fine job of discussing the merits and approaches to this methodology. Though we intend to adapt it • Where is it used? • The Front Range CFLRP adaptation to this method, instead of measuring typically finer scale variation amongst understory vegetation, would instead focus on the overstory tree structure by means of identified structural stage with its roughly estimated stem count for each segment of that stage • How does it work? • The transects would span the distance from one randomly selects USFS Common Stand Exam plot to another, e.g. Point 1 to 2 would be transect 1 • Measure distance of each predominant structural component in linear feet of the over story (or regeneration) (VSS 1, VSS 2, VSS 3, and so on, drip line to drip line), and openings (either inter-space, or persistent meadows). • Quickly count (roughly estimate?) number of stems in the structural component, possibly redundant to the USFS Common Stand Exam (CSE). • End Result • If one passes through lets say 6 different structural components, then there ought to be 6 different segments that add up to the total length of the transect. • From this relative proportion of site occupancy of each structural class, inter-space, and persistent meadow, and associated summary statistics. • Potentially able to estimate abundance and determine stocking, if not to corroborate the Common Stand Exam results, again, may be redundant?
Stem Map Legend CSE Point 2 Transect 1 CSE Point 1 Seedlings & Saplings (VSS 1) Meadows & Inter-space Small Poles (VSS 2) Black jack (VSS 3) Yellow Pine (VSS 4) USFS Common Stand Exam Point Plot center is a Variable Radius Prism plot (10 or 20 BAF), with nested plots below Openings & structure transect 1/1000 understory indicator species Acre delineation 1/100 regeneration plot 1/10 exotics presence/absence plot