Upcoming Schedule PSU Stat 2014
210 likes | 364 Views
Upcoming Schedule PSU Stat 2014. JANUARY FINALS SCHEDULE: Here is the Finals Schedule for the end of the grading period in January. Tuesday, January 21, 2014 – Monday Schedule Wednesday, January 22, 2014 Period 1 Final 8:05-9:35

Upcoming Schedule PSU Stat 2014
E N D
Presentation Transcript
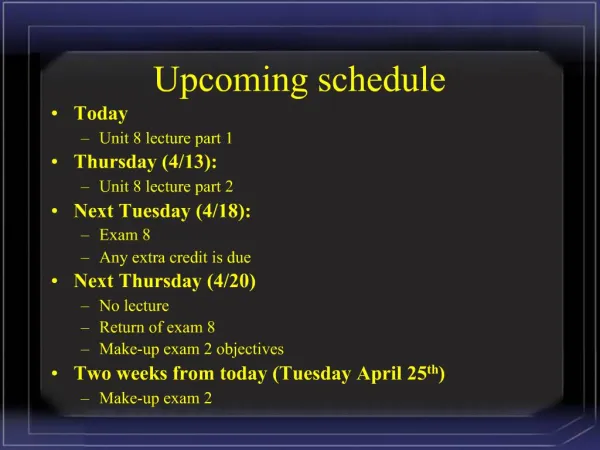
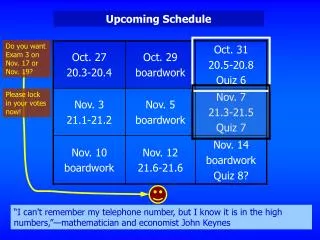
JANUARY FINALS SCHEDULE: Here is the Finals Schedule for the end of the grading period in January. Tuesday, January 21, 2014 – Monday Schedule Wednesday, January 22, 2014 Period 1 Final 8:05-9:35 Period 2 Final 9:40-11:10 Lunch 11:10-11:55 Period 3 Final 12:00-1:30 Proficiency Make Up Testing 1:35-3:05 Thursday, January 23, 2014 Period 4 Final 8:05-9:35 Period 5 Final 9:40-11:10 Lunch 11:10-11:55 Period 6 Final 12:00-1:30 Proficiency Make Up Testing 1:35-3:05 Friday, January 24, 2014 Period 7 Final 8:05-9:35 Period 8 Final 9:40-11:10 Lunch 11:10-11:55 Proficiency Make Up Testing 12:00-3:05 Monday, January 27, 2014 – Teacher Planning Day
Confidence Interval of the Mean Bluman, Chapter 6
95% Confidence Interval of the Mean Bluman, Chapter 7
Confidence Interval of the Mean for a Specific Common confidence intervals, CI, and z scores associated with them.
7.2 Confidence Intervals for the Mean When Is Unknown The value of , when it is not known, must be estimated by using s, the standard deviation of the sample. When s is used, especially when the sample size is small (n<30), critical values greater than the values for are used in confidence intervals in order to keep the interval at a given level, such as the 95%. These values are taken from the Student t distribution, most often called the t distribution. Bluman, Chapter 7
Characteristics of the t Distribution The t distribution is similar to the standard normal distribution in these ways: 1. It is bell-shaped. 2. It is symmetric about the mean. 3. The mean, median, and mode are equal to 0 and are located at the center of the distribution. 4. The curve never touches the x axis. Bluman, Chapter 7
Characteristics of the t Distribution The t distribution differs from the standard normal distribution in the following ways: 1. The variance is greater than 1. 2. The t distribution is actually a family of curves based on the concept of degrees of freedom, which is related to sample size. 3. As the sample size increases, the t distribution approaches the standard normal distribution. Bluman, Chapter 7
Degrees of Freedom • The symbol d.f. will be used for degrees of freedom. • The degrees of freedom for a confidence interval for the mean are found by subtracting 1 from the sample size. That is, d.f. = n - 1. • Note: For some statistical tests used later in this book, the degrees of freedom are not equal to n - 1. Bluman, Chapter 7
Formula for a Specific Confidence Interval for the Mean When IsUnknown and n < 30 The degrees of freedom are n - 1. Bluman, Chapter 7
Chapter 7Confidence Intervals and Sample Size Section 7-2 Example 7-5 Page #371 Bluman, Chapter 7
Example 7-5: Using Table F Find the tα/2 value for a 95% confidence interval when the sample size is 22. Degrees of freedom are d.f. = 21. Bluman, Chapter 7
Chapter 7Confidence Intervals and Sample Size Section 7-2 Example 7-6 Page #372 Bluman, Chapter 7
Example 7-6: Sleeping Time Ten randomly selected people were asked how long they slept at night. The mean time was 7.1 hours, and the standard deviation was 0.78 hour. Find the 95% confidence interval of the mean time. Assume the variable is normally distributed. Since is unknown and s must replace it, the t distribution (Table F) must be used for the confidence interval. Hence, with 9 degrees of freedom, tα/2 =2.262. Bluman, Chapter 7
Example 7-6: Sleeping Time One can be 95% confident that the population mean is between 6.5 and 7.7 inches. Bluman, Chapter 7
Chapter 7Confidence Intervals and Sample Size Section 7-2 Example 7-7 Page #372 Bluman, Chapter 7
Example 7-7: Home Fires by Candles The data represent a sample of the number of home fires started by candles for the past several years. Find the 99% confidence interval for the mean number of home fires started by candles each year. 5460 5900 6090 6310 7160 8440 9930 Step 1: Find the mean and standard deviation. The mean is = 7041.4 and standard deviation s = 1610.3. Step 2: Find tα/2 in Table F. The confidence level is 99%, and the degrees of freedom d.f. = 6 t .005 = 3.707. Bluman, Chapter 7
Example 7-7: Home Fires by Candles Step 3: Substitute in the formula. One can be 99% confident that the population mean number of home fires started by candles each year is between 4785.2 and 9297.6, based on a sample of home fires occurring over a period of 7 years. Bluman, Chapter 7
Z or t; see page 373 Please read the paragraph on top of the page. Bluman, Chapter 7
z or t, page 373 Iss known? No yes • Use ta/2values and s in the formula Use Za/2 values and s in the formula Bluman, Chapter 7
Homework Sec 7.2 Page 374 #1-4 all and 5-19 every other odds Optional: if you have a TI 83 or 84 calc see page 376 Bluman, Chapter 7