Download
1 / 1
10 likes | 109 Views
Explore high-resolution radio observations of the extragalactic source J1819+3845, revealing jet-like structures and variability due to interstellar scintillation. Dive into the polarisation observations and spectral index distribution of this intriguing source.

E N D
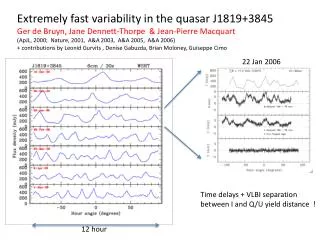
High-Resolution Radio Observations of the Scintillating Extragalactic Source J1819+3845 Brian Moloney1, Denise Gabuzda1, A. G. De Bruyn2,3, J.P. Macquart3, L. Gurvits4, J. Dennett-Thorpe5 • University College Cork, Cork, Ireland • ASTRON, Postbus 2, 7990 AA, Dwingeloo, The Netherlands • Kapteyn Astronomical Institute, University of Groningen, The Netherlands • JIVE, Postbus 2, 7990 AA, Dwingeloo, The Netherlands Results Abstract 22GHz: Removing the intervals of strongest variability from the data essentially lowered the overall noise level in the image without changing the overall structure or flux levels. A jet-like structure to the North is visible, with the polarisation peak clearly offset in the direction of this jet. The peak of the polarised flux is separated from the I peak by ~0.3mas, qualitatively confirming the a priori prediction based on the observed time delay between the I and P scintillation curves. Below: 22GHz intensity map, overlaid with polarisation vectors, having removed variability effects. The quasar J1819+3845 is one of the most extremely variable extragalactic sources known at radio-wavelengths, exhibiting variations in excess of a factor of 10 at 5GHz (50-500mJy) on a timescale of hours. It has been confirmed that the source of this variability is interstellar scintillation [Dennett-Thorpe and De Bruyn 2003]. Polarisation Observations of this source were made at 8GHz and 22GHz using the VLA and global VLBI arrays in June 2003. At both frequencies the structure comprised a compact core and a polarised component to the North with a well-developed jet structure. Analysis of the VLBI images and the spectral index distribution are presented. Our analysis indicates a constant jet with a variable (scintillating) core. We have applied for further VLBA observations to confirm these results. Background • J1819+3845 is a source that displays intra-day variability (IDV), there are two main hypotheses that attempt to explain this behaviour: • Intrinsic Variability:This explanation supposes that the IDV arises within the source itself. The problem with this theory is that, if the variability time scale reflects the size of the emission region, it implies physically difficult brightness temperatures ~1017 K, which exceed the Inverse Compton limit of ~1012 K. • Extrinsic Variability:In this case, the variability is introduced by the medium between the source and the observer. The material encountered by the radiation as it propagates from the source to the Earth causes the light from the source to be focused and de-focused, resulting in an amorphous pattern that is shadowed onto the Earth’s orbit. Corresponding annual variations due to variations in the relative velocity of the Earth and intervening medium have been observed in the scintillation pattern of a handful of rapidly variable sources, including J1819+3845 [Dennett-Thorpe & De Bruyn 2003]. However, this explanation is not able to explain possible correlations between optical and radio-wavelength variability observed for several other objects. • Two key results prove conclusively that J1819+3845’s variability is due to interstellar scintillation: • Clear annual variations in the scintillation rate due to variations in the relative velocity of the Earth and intervening medium have been observed. • Simultaneous observations carried out at the VLA in New Mexico and Westerbork Synthesis Radio Telescope (WSRT) in the Netherlands clearly showed the same scintillation pattern, but with a time delay of about 100 seconds (due to the velocity introduced by the Earth’s rotation). In contrast to the expectation for the simplest case, WSRT led the VLA at the beginning of the observations, but lagged the VLA at the end (see below, right). This was interpreted as evidence that the scattering plasma has a net velocity transverse to the LSR, with components vra = -32.50.5 km/s, vdec=15.5 1 km/s; once taken into account, the light-curves for both antennas agreed exceptionally well. Above: 22GHz map ignoring all scintillation effects, overlaid with polarisation vectors 8GHz: The images made with data subsets based on the intensity slices all showed the same general structure, although the peak fluxes of the three maps differed in accordance with the flux levels of the corresponding slices. The jet structure to the North is revealed most clearly by the presence of polarisation to the North of the I peak, which is present in the image for each slice with approximately the same P flux level (~1.7mJy). We plan to carry out model-fitting to more accurately quantify the changes in the I and P component flux levels that are occurring during the scintillations. Above: 8GHz intensity maps with polarisation vectors. To the far left is the complete data set ignoring any variability effects, this is followed by the high, middle, and low level intensity slices Comparison:To facilitate comparison between the images, the 8GHz image was convolved with the 22GHz beam; this more clearly displays the structure to the North of the I peak, and reveals a possible weaker component to the South of the peak. If the brightest feature in each of the images correspond, this region is optically thin (α = -0.6; Sυ υα). However, if the weak southern feature at 8 GHz corresponds to the southern feature at 22 GHz (the 22 GHz core), this implies α = +2.0, -2.4 and –0.5 for the core and two jet components. Confident alignment of the images is hindered by the large difference in resolution and the relative fluxes of the components, and we cannot be sure which of these identifications is more correct. We have applied for new multi-frequency, phase-referenced VLBA observations to address this problem. Above: the middle 8GHz slice convolved with the 22GHz beam. The distance to the scattering screen, D, can be derived by relating the measured angular offset between the I and P peaks, Δθ, and the I-P scintillation time lag Δτ. The observed lag is the time required for the scintillation pattern to cross the length, (v. Δθ)D, which is the distance subtended by the angular offset between the I and P sources projected along the scintillation velocity v: Δτ = (v.Δθ)D / |v| Our preliminary analysis indicates that the I-P time delay Δτ is of the order of 30 minutes, and that the angular offset is ~0.3 mas North; together with the velocity v = -32.5 km/s East and +15.5 km/s North, this implies that we a dealing with a nearby screen, at a distance D 1.6 pc. Above left is a schematic of the interstellar scintillation process. To the right are the light curves from simultaneous WSRT and VLA observations. The curves are clearly correlated, and show remarkable agreement once the inferred velocity of the plasma has been taken into account. Comparison of the total intensity (I) and polarised (P) scintillation curves revealed a delay between them, interpreted as evidence for an offset between the I and P scintillating components on the sky. The results presented here were obtained from Very Long Baseline Interferometry (VLBI) observations designed to directly test this hypothesis. Observations & Analysis We obtained global VLBI observations at 8GHz and VLBA observations at 22GHz in June 2003. Both arrays included the phased VLA, providing a record of the integrated variability during the VLBI observations. The aim of these experiments was to directly search for the inferred offset between the compact I and P structures, and also to study the compact radio structure in further detail. The preliminary calibration and imaging was performed in the NRAO AIPS package using standard techniques. The presence of source variability during the observations violates the usual assumption that the source structure is constant for the entire time interval used in the imaging. Initial maps made ignoring the scintillation displayed a compact core with a jet structure to the North at both frequencies. Conclusions • Our observations clearly show a jet structure, with the peak polarised flux lying to the North of the I peak. This provides direct confirmation of the offset between the I and P compact components predicted based on an earlier analysis of the integrated I and P scintillation curves. • We have developed and applied a technique for dividing the data into subsets corresponding to a single flux level for the scintillating component(s). • There is some evidence for a weak component just to the South of the peak in the 8 GHz image, but this must be confirmed by future observations. • We plan to carry out more detailed model fitting of the 8 and 22 GHz visibility data, as well as a comparative analysis of the scintillations observed at the VLA and WSRT, both of which were included in our global VLBI array at 8 GHz. • A preliminary analysis of the I-P time delay and the I-P angular offset indicates that the scintillation is predominantly occurring in a nearby “screen”, at a distance of only D 1.6 pc. • Our pending VLBA proposal for future multi-frequency, phase-referenced observations will allow us to: • Study the rapid evolution of J1819+3845 and determine estimates of possible superluminal speeds via comparison with the above images. • Accurately align and compare the images, thus allowing reliable derivation of the spectral-index and Faraday-rotation distributions. We attempted to partially take into account scintillation effects using light-curves for both frequencies averaged over all baselines obtained with the task TBAVG in AIPS. As expected, the 22GHz data showed relatively minor scintillations, and we simply removed several limited time ranges in which the highest-amplitude scintillations were observed before re-mapping the data. The 8GHz map (predictably) showed much more variability, and to account for this we took “intensity slices” of the data corresponding to three different flux levels, each with a width of 4 mJy. This essentially groups together data corresponding to a given flux level for the scintillating component(s), although it is not possible to do this perfectly because the scintillation patterns at the individual telescopes will be received at slightly different times. The data outside of these flux levels was flagged, and the data subsets then imaged in the usual way. References Dennett-Thorpe J., De Bruyn A.G. 2002, Nature 415, 57 Dennett-Thorpe J., De Bruyn A.G. 2003, A&A, 404, 113 Above are the intensity curves during the course of our observations. To the left is the 22GHz curve and to the right is the 8GHz curve with lines overlaid where the intensity slices were taken.