Download
1 / 34
350 likes | 487 Views
Lake Temagami Fall Walleye Index Netting Project 2001. George Morgan Extension Biologist Cooperative Freshwater Ecology Unit. What is Index Netting?.

E N D
Lake TemagamiFall Walleye Index Netting Project 2001 George Morgan Extension Biologist Cooperative Freshwater Ecology Unit
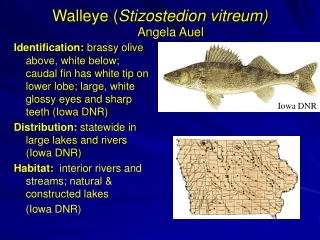
What is Index Netting? • Index netting is a standardized, rapid assessment technique or method that is designed to determine relative abundance and provide other biological measures or indicators of a fish population’s status
Q&A: What method should I use to assess my walleye population? • Are you interested in… • Adult and juvenile walleye • Is lethal sampling acceptable? • Yes • No • Then use… • Fall Walleye Index Netting (FWIN) • Early Summer Trap Netting (ESTN)
What is Fall Walleye Index Netting? • Gillnetting procedure in the fall • Net is 8 panels each 7.6m by 1.8m: • 25, 38, 51, 64, 76, 102, 127 & 152mm mesh • Temperature 1510oC • Random net locations • 2 depth strata: • 2-5m & 5-15m • Kills fish!
What can you measure with FWIN? • Species and number caught • Fork and total length, girth • Wet, dressed, and filet weight • Bony structures for age interpretation • Determine sex and maturity • Stomach contents • Gonad weight • Organ weight (e.g., liver) • Visceral fat weight • Contaminant and genetic samples
Q&A: What method should I use to assess my walleye population? • Are you interested in… • Adult walleye (>300mm total length) • Is lethal sampling acceptable? • Yes • No • Then use… • Fall Walleye Index Netting (FWIN) • Early Summer Trap Netting (ESTN)
What is Early Summer Trap Netting? • Trapnetting procedure in the early summer • NSCIN net: • 1.8m trapnet with 45.7m leader • Temperature 1218oC • Random net locations • Specific site selection criteria • Live release of fish!
What can you measure with ESTN? • Species and number caught • Fork and total length, girth • Wet, dressed, and filet weight? • Bony structures (spines) • Determine sex and maturity • Stomach contents • Gonad weight • Organ weight (e.g., liver) • Visceral fat weight • Contaminant and genetic samples
Lake Temagami Area = 20971.7ha Max. depth = 110m Mean depth = 18.2m Secchi = 10.7m GDD = 1538 Ontario Walleye Lakes Area 102 to 759ha Max. depth 8.2 to 23.6m Mean depth 2.7 to 4.3m Secchi 2.0 to 3.7m GDD 1275 to 1500 Lake Temagami isNot your Typical Walleye Lake So… Lake Temagami is a large, deep, clear, cool lake (should be more favourable for coldwater species like lake trout).
Lake Temagami FWIN 2001 • Concentrated sampling effort in “The Hub” (recommended sampling area by Chuck McCrudden) • Crew set and lifted 6 nets per day from September 26 to 30th • Total of 24 sets (22 useful sets; 2 tampered)
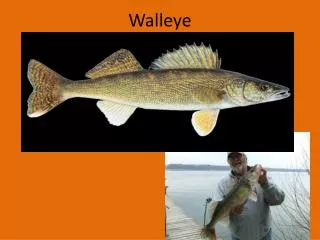
WHAT DID WE CATCH? 1 Lake trout 49 Lake whitefish 63 Lake herring 8 Northern pike 68 White sucker 1 Lake chub 1 Burbot (Ling) 105 Rock bass 1 Pumpkinseed 38 Smallmouth bass 14 Yellow perch 127 WALLEYE Lake Temagami FWIN 2001
Making a Diagnosis • Compare observed FWIN walleye abundance (number per net) to other Ontario lakes • Abundance compared to provincial and northeast region benchmarks How is the health of the “patient” today?
Walleye Relative Abundance Lake Temagami abundance as expected based on climate and productivity.
Making a Diagnosis (Forecast) • Compare biological parameters to regional benchmarks • Compare biological parameters to regional regression models
Making a Diagnosis (Forecast) • Compare biological parameters to regional benchmarks • Compare biological parameters to regional regression models
What information can I get from a FWIN survey? • Relative abundance • Size distribution • Age distribution & mortality • Growth & condition • Sex ratio & maturity • Reproductive characteristics • Relative stock density
Protected Slot Lake Temagami WalleyeSize Distribution Lake Temagami average size 362mm (14.2in). Smallest fish 132mm (5.2in). Largest fish 760mm (29.9in).
Protected Slot Lake Temagami Walleye“Corrected” Size Distribution Lake Temagami slot will protect 5.7% of the population.
Lake Temagami WalleyeAge Distribution (by sex) Average age 2.5 years. Oldest fish 14 years. Balanced sex ratio (49% males: 51% females).
Lake Temagami Walleye“Corrected” Age Distribution Population supported by 3 strong year-class (1999 to 2001). Annual adult mortality is 29% after age 5 (too high).
Protected Slot Lake Temagami Walleye Growth Lake Temagami male and female size is much higher than regional average after age 1.
Lake Temagami Walleye Condition Lake Temagami male and female condition is higher than regional average.
Protected Slot Lake Temagami Walleye Maturity by Size Males 50% mature at 373mm (14.7in). Females 50% mature 448mm (17.6in) and 90% mature at 471mm (18.5in).
Lake Temagami Walleye Maturity by Age Males 50% mature at 2.5yrs. Females 50% mature at 3.6yrs.
Lake Temagami WalleyeEgg Production Lake Temagami egg production is much lower than regional average.
Lake Temagami Walleye Fecundity-by-Size Lake Temagami fecundity is much lower than regional trendline.
Making a Diagnosis (Forecast) • Compare biological parameters to regional benchmarks • Compare biological parameters to regional regression models
L • How fast do walleye grow? • Pre-maturation growth is linear • Growth after maturity follows von Bertalannfy growth formula • When do walleye mature? • What is their potential rate of population increase? r’ = (ln fecundity @ Lm)/Tmature Lt = L (1-e -K(t-t0 )) Lm Total Length (mm) slope = h Tmature Age at time t (yr) Important life history questions
NE Female Walleye Life History Relationships Environment (Growing Degree Days, Secchi) Early growth (h = mm/yr) h = 60.055 + 12.253 Secchi , R2 = 0.26 Relative Condition Relative Conditionf = 0.762 + 0.0002 GDD , R2 = 0.24 Length at maturation (mm) Lmf = 369.116 + 0.782 h , R2 = 0.17 Gonadosomatic index (%) GSIf = 1.725 + 0.024 h , R2 = 0.26 Visceral fat index (%) VFIf = -10.407 + 12.291 Conditionf , R2 = 0.42 Potential population increase (r') r' = 0.020 h+ 0.002 GDD- 1.477, R2 = 0.67 Asymptotic length (mm) L = 526.636 - 4.922 A% + 0.840 Lmf , R2 = 0.60
Lake Temagami Female Walleye Lake Temagami Environmental Conditions (Growing Degree Days = 1538, Secchi = 10.7m?) Early growth (h = mm/yr) Predicted h = 191mm/yr Observed h = 113mm/yr [Unexploited population h = 51mm/yr] Relative Condition Predicted Relative Conditionf= 1.07 Observed Relative Conditionf= 1.06 Length at maturation (mm) Predicted Lmf = 457mm Observed Lmf = 448mm Gonadosomatic index (%) Predicted GSIf = 4.43% NO DATA COLLECTED Visceral fat index (%) Predicted VFIf = 2.62% NO DATA COLLECTED Potential population increase (r') Predicted r' = 3.85 Observed r' = 2.83 to 3.03 Asymptotic length (mm) Predicted L= 775mm Observed L= 792mm
Lake Temagami Walleye Status • This lake supports a stressed walleye population. The population is dominated by young, immature, fast growing year-classes. Mortality is high enough to lower the number of adult walleye present in this population and few fish reach old age.