Download
1 / 25
250 likes | 378 Views
An introduction to McIDAS – the M an- c omputer I nteractive D ata A ccess S ystem. (as part of the 22 st Annual CIMSS Summer Workshop on Atmospheric and Earth Sciences – 23 June 2014). 10:30 AM – 12:30 PM

E N D
An introduction to McIDAS– the Man-computer Interactive Data Access System (as part of the 22stAnnual CIMSS Summer Workshop on Atmospheric and Earth Sciences – 23 June 2014) 10:30 AM – 12:30 PM - McIDAS/satellite overview (Gary); McIDAS-V training (Jay and Bob). - McIDAS hands-on development of mini-projects (w/additional mentors Rick, Will, Barry, and Mat) <lunch> 01:15PM – 02:15 PM - review McIDASmini-projects, concluding with student presentations of such.
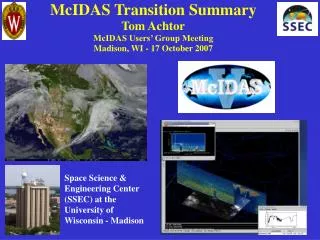
Who We Are SSEC (Space Science and Engineering Center) is part of the Graduate School of the University of Wisconsin-Madison (UW). SSEC hosts CIMSS (Cooperative Institute for Meteorological Satellite Studies), including a NOAA/NESDIS (National Oceanic and Atmospheric Administration /National Environmental Satellite, Data, and Information Service) research branch – ASPB (Advanced Satellite Products Branch).
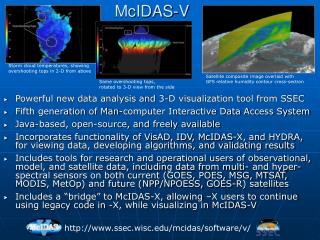
What Is McIDAS-V? McIDAS – Man computer Interactive Data Access System • Powerful data analysis and 3-D visualization tool • McIDAS-V is the fifth generation of McIDAS • “V” stands for 5 (the Roman Numeral V) • The first generation of McIDAS began in 1972 Storm cloud temperatures, showing overshooting tops in 2-D from above Satellite composite image overlaid with GFS relative humidity contour cross-section Same overshooting tops, rotated to view from the side
What Is McIDAS-V? McIDAS-X VisAD + IDV + HYDRA =McIDAS-V • Viewing data, developing algorithms, validating results • Integration of geophysical data • Ease of reprojection • Remote and local data access • Includes a “bridge” to McIDAS-X, allowing –X users to continue using legacy code, but to visualize in McIDAS-V
McIDAS Users Group (MUG) members June 2012 • 3TIER Group – Seattle, WA • Agencia Estatal de Meteorologia (AEMET) – Madrid, Spain • Antarctic Meteorological Research Center – Madison, WI • Australian Bureau of Meteorology – Melbourne, Australia • Aviation Weather Center - Kansas City, MO [NOAA] • The Boeing Company – Seattle, WA • Comision Nacional de Actividades Espaciales (CONAE) – Buenos Aires, Argentina • Comprehensive Large Array-Data Stewardship System (CLASS) – Asheville, NC [NOAA] • Energia Logistics Ltd. – Long Beach, CA • Environment Canada – Downsview, Ontario • Environmental Satellite Processing Center – Suitland, MD [NOAA] • European Organization for the Exploitation of Meteorological Satellites (EUMETSAT) – Darmstadt, Germany • Harris Corporation – Melbourne , FL • Honeywell Aerospace Electronic Systems – Redmond, WA • Hong Kong Observatory – Kowloon, Hong Kong • ImpactWeather, Inc. – Houston, TX • ITOCHU Techno-Solutions Corporation – Tokyo, Japan • Johnson Space Center Spaceflight Meteorology Group – Houston, TX • Kwajalein Atoll - Atmospheric Technology Services Company – Kwajalein Atoll • Masdar Institute of Science and Technology – Abu Dhabi, UAE • Mexico National Water Commission – Mexico D.F., Mexico • NASA Langley Research Center – Hampton, VA • NASA Marshall Space Flight Center – Huntsville, AL • National Hurricane Center – Miami, FL [NOAA] • National Transportation Safety Board – Washington, DC • National Weather Service Pacific Region Headquarters – Honolulu, HI [NOAA] • National Weather Service Western Region Headquarters – Salt Lake City, UT [NOAA] • Northrop Grumman Information Systems – McLean, VA • Range Weather Operations, Cape Canaveral Air Station – Patrick Air Force Base, FL • Regional and Mesoscale Meteorology, Cooperative Institute for Research in the Atmosphere – Fort Collins, CO [NOAA] • Storm Prediction Center – Norman, OK [NOAA] • Telvent DTN – Burnsville, MN • Unidata Program Center – Boulder, CO • University of Wisconsin - Madison, Space Science & Engineering Center – Madison, WI • VisionTech, Inc. – Ibaraki, Japan • Weather Central, LP – Madison, WI • Weather Decision Technologies, Inc. – Norman, OK • Weathernews America, Inc. – Norman, OK • WTVT Fox 13 Weather – Tampa, FL
On 6 December 1966, the Applications Technology Satellite (ATS-1) was launched. We have had the benefit of the geostationary perspective for over 45 years! ATS-1's spin scan camera (UW’s Suomi and Parent 1968) provided full disk visible images of the earth and its cloud cover every 20 minutes. The spin scan camera on ATS-1 occurred because of extraordinary efforts by Verner Suomi and Homer Newell, when the satellite was already well into its fabrication.
Professor Suomi and McIDAS (Man computer Interactive Data Access System) an 1972 – “McIDAS” 2014 – “McIDAS-V” Including VIS-AD and HYDRA
Water vapor tracked “winds” from Meteosat during FGGE (the First Global Atmospheric Research Program (GARP) Global Experiment) (15 Nov 1979)
1968 WINDCO generates wind vectors from ATS images History of McIDAS 1972 First Generation of McIDAS Runs on Harris /5 with 96 KB of programmable memory and 2-5 MB hard drives 1991 McIDAS runs on UNIX workstations 1997 McIDAS Users’ Group sunsets support for mainframe McIDAS 1983 People’s Republic of China funds port of McIDAS software to IBM mainframe 1970 1980 1990 2000 1976 GOES ingest system added to McIDAS 1994 Satellite and conventional data is served from UNIX workstations, beginning the use of ADDE (Abstract Data Distribution Environment) 1985 McIDAS runs on PCs under DOS operating system 1979 Wichita Falls, TX tornado disaster: Congress directs operational McIDAS system to be installed at the NOAA National Severe Storms Forecast Center 1987 McIDAS runs on PCs under OS/2 operating system and McIDAS Users’ Group is formed
History of McIDAS-V • 2006 - Investigations of a “new approach” to data analysis and visualization • 2007 – Collaboration with Unidata to advance VisAD and IDV as the basis of McIDAS-V • 2008 – McIDAS-V becomes an “alpha” • 2009 – January – beta 1 • 2010 – January – beta 5 • 2010 – September – V1.0 • 2012 – May – V1.2 (scripting capability demonstrated and promoted) • 2014– June – latest version is V1.4
(Some) Meteorological Satellites and Instruments (2014) Eastern Hemisphere: Meteosat-8,7 INSAT-3A,3B,3D Kalpana Electro-L FY-2D,E COMS-1 MTSAT-1R X GOES-15 - Imager - Sounder 135 W GOES-13 - Imager - Sounder 75 W Meteosat-10 MSG-2 - SEVIRI 0 E MTSAT-2 (Himawari-7) Imager 145 E GOES-14 - Imager - Sounder 105 W GOES-12 - Imager - Sounder 60 W ~ 36,000 km -- 24hrs GEO LEO NOAA-19 - AVHRR/3 - HIRS/4 - AMSU - MHS 13:30 NOAA-18 - AVHRR/3 - HIRS/4 - AMSU - MHS 15:00 • Suomi NPP • - VIIRS • CrIS • ATMS • 13:30 AM DMSP F-18 - SSM/IS 08:00 DMSP F-17 - SSM/IS 05:30 • Metop-B • - AVHRR/3 • HIRS/4 • IASI • - AMSU • - MHS • 09:30 • Metop-A • - AVHRR/3 • HIRS/4 • IASI • - AMSU • - MHS • 09:30 ~ 850 km -- 100 min • Aqua • - MODIS • AIRS • 13:30 Terra - MODIS 10:30 PM (http://www.wmo.int/pages/prog/sat/satellitestatus.php) [ sats-o-day-gsw-20140620.pptx ]
MODIS data - define a transect to display radiance measurements Convection case study:19 June 2007
Thunderstorm features: over-shooting top and enhanced-V (thermal couplet) Setvak:http://www.convection-wg.org/sandwich.php Brunner et al.:http://cimss.ssec.wisc.edu/snaap/enhanced-v
Advanced Display Capability AIRS Level 1B window channel image (grey-scale) and moveable 2-D slice of ECMWF-AIRS Single FOV water-vapor retrieval (color-scale). Slice values are re-sampled on the fly from the 3-D difference field and auto-updated as the slice is dragged in space - demonstrating interactive direct manipulation, data integration, and python driven data computation.
High spectral data from AIRS (onboard the Aqua satellite) is used to generate the UW Cloud Amount Vertical Profile (CAVP), shown as a “3-D” cloud in McIDAS-V .
Bringing observations of clouds together:MODIS (passive) and CALIPSO (active)
Under development: interrogation of vertical structure of surrounding reference winds model analysis and/or in-situ obs at location of flagged AMV derived wind. AMV derived wind color scaled by wind speed ; GFS gridded wind field in magenta
Infrared electromagnetic spectrum of the atmosphere Spectral response functions for the 18 infrared GOES Sounder bands, separated into long, mid, and shortwave sections. Incoming solar radiation peaks in the visible, near 0.5 um (corresponding to a radiative temperature of 5780K for the Sun’s surface); outgoing terrestrial radiation peaks in the infrared, near 11 um (corresponding to an average earth radiative temperature of 255K). [ from Wein’s Law] Various gaseous constituents effect the amount of absorption at the different wavelengths.
All spectral bands of the GOES Sounder ( GOES-13 (East) at 15:46 UTC on 23 June 2013 )
Looking at real-time GOES Sounder data… cimss.ssec.wisc.edu/goes/rt/exp-work.php • Look at all spectral bands • Look at a Sounder product [This workshop PowerPoint is available at -- http://cimss.ssec.wisc.edu/~garyw/sum-wrkshp/2014/.]
Atmospheric soundings from geostationary orbit Below is total precipitable water (TPW) derived from the Sounder on GOES-13 at 12 UTC on 23Jun 2013. As a cold front drops across the N Hi Plains bringing drier air, the E and rest of the central US stay under very moist air (previously advected from the Gulf of Mexico region) as a warm front moves up across the Great Lakes. Smooth GOES retrievals (profiles) are similar to near-by radiosonde profiles. [ http://cimss.ssec.wisc.edu/goes/realtime/eus/begin-eus.html]