Download
1 / 20
200 likes | 217 Views
This report provides an overview of the water quality indicators and monitoring design implemented by the Albemarle-Pamlico National Estuary Program (APNEP). It outlines the program's objectives, identifies regional ecosystem goods and services, and highlights the progress made in developing water quality indicators. The report also discusses the challenges faced in monitoring and proposes an integrated monitoring plan.

E N D
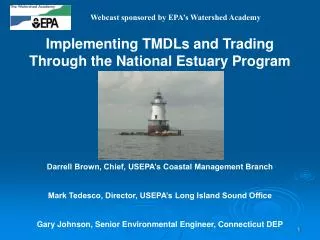
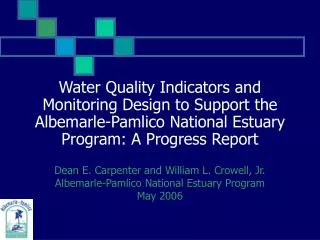
Water Quality Indicators and Monitoring Design to Support the Albemarle-Pamlico National Estuary Program: A Progress Report Dean E. Carpenter and William L. Crowell, Jr. Albemarle-Pamlico National Estuary Program May 2006
Water Quality Indicators & Monitoring Roadmap • Program & Region • Science & Technical Advisory Committee • Water Quality & Hydrology Indicators • Future & Integrated Monitoring
APNEP Programmatic & Science-Technology Missions To identify, restore, and protect the significant resources of the Albemarle-Pamlico estuarine system. To facilitate the effective use of science, technology, training, and information in the planning, management, and evaluation of ecosystems within the APNEP region
Regional Ecosystem Goods • Food for humans and animals (e.g., fish, shellfish , seagrasses, livestock, grains) • Salt • Minerals and oil resources • Construction materials (e.g., sand, rock, coral, lime, wood) • Biodiversity (e.g., genetic stock for biotechnology, medicinal)
Regional Ecosystem Services • Shoreline protection (e.g., storms, erosion) • Storing and cycling nutrients • Biodiversity • Water quality • Recreation • Tourism • River and marine transport
Science & Technology Objectives • Ultimate Objective: “State of the Sounds” periodic assessments • Initial Objective: APNEP has indicators in place to track key environmental and other trends based on CCMP priorities and emerging issues, and periodically report on status and trends • Background Objective: Regional NC Pilot
Science & Technology Resources • FY06 S&T Budget • SAV Mapping • Citizens Monitoring Network • STAC meetings • Leveraging • Partnering
Science & Technology Advisory Committee (STAC) • By-Laws • Public & private membership • 36 seats, staggered terms • Executive Board • No state agency representation • Operational Guidelines • Quarterly Meetings • Presentations
APNEP Indicators Progress • Draft indicator framework by STAC Ad-Hoc Committee • Indicator framework and proposed indicators from two-day STAC indicator workshop • Crosswalk with Heinz Center indicators • Atlantic Slope Consortium, Atlantic Coast Environmental Indicators Consortium, and Chesapeake Bay Indicators • EPA Indicator Development for Estuaries
STAC Water Quality & Hydrology Indicators • Type I • Pathogens • Freshwater Flow • Water Clarity • Type II • Nutrients • Groundwater Storage • DO • Chlorophyll-a
STAC Water Quality & Hydrology Indicators • Type II-III • Toxic Substances • Metals Concentration • Phytoplankton/Periphyton
Water Quality Monitoring in APNEP Region • NC Division of Water Quality • Ambient Monitoring System: Inland Waters (~150 river/creek + ~40 lake/reservoir stations, monthly minimum) • Physical (Hydrolab or sonde): DO, water temperature, conductivity, pH, Secchi depth, salinity • Chemical-Biological (surface): metals, turbidity, solids/residue, fecal coliform • Chemical-Biological (photic zone): nutrients (N & P), chlorophyll-a, phytoplankton
Water Quality Monitoring in APNEP Region • VA Department of Environmental Quality • Ambient Watershed • 106 long-term and rotational stations, bimonthly • Nutrients, solids, fecal coliform, E. coli, hardness, temperature, pH, DO, conductivity • Probabilistic (ProbMon) • 19 random-grid stations, sampled spring and autumn • Nutrients, fecal coliforms, E. coli, dissolved metals, sediment metals, sed organics, particle size, temperature, DO, pH, conductivity • TMDL Monitoring: 73 stations • “Other”: Special Studies
Water Quality Monitoring in APNEP Region • US Geological Survey: NC • Water Quality Monitoring System: Lower Neuse, Pamlico, Roanoke Rivers (~ 11 stations, 5-60 minutes, 4 hour upload) • Physical (Hydrolab): DO, water temperature, pH, salinity • US Geological Survey: VA • Pasquotank River Basin (~2 stations 5-60 minutes, 4 hour upload) • Physical: water temperature
Water Quality Monitoring in APNEP Region • US EPA’s National Coastal Assessment • Albemarle-Pamlico Sounds (~ 23 stations, annual) • Water quality index (DO, chlorophyll-a, nitrogen, phosphorus, water clarity) • Sediment quality index (including sediment toxicity, sediment contaminants, and sediment total organic carbon [TOC]) • FerryMon • Pamlico Sound & Neuse River (3 ferry routes, 3 minute intervals) • Surface water temperature, salinity, DO, pH, turbidity, chlorophyll-a fluorescence (algal biomass)
APNEP Monitoring Challenges • Survey of Contemporary Monitoring Networks • Survey of Proposed Monitoring Networks (e.g, National Water Quality Monitoring Network) • Role of APNEP Citizen’s Monitoring Network • Feedback from APNEP Policy Board and Citizen Advisory Committee • Integrated Monitoring Proposal