Download
1 / 20
200 likes | 218 Views
This article discusses how satellites have aided in connecting the shrinking snow caps to increasing productivity in the Arabian Sea. It explores the impact of changing monsoons on phytoplankton, fisheries, oxygen levels, and rainfall patterns.

E N D
Increasing productivity in the Arabian Sea linked to shrinking snow caps – How satellites helped connect the dots Joaquim I. Goes and Helga Gomes Bigelow Laboratory for Ocean Sciences Prasad Thoppil Naval Research Laboratory, Stennis Space Centre John Fasullo PAOS, Univ. of Colorado, CO, USA
Jan 2002 Estimating Nitrate In The World’s Oceans and its utility to study environmental regulation of nitrate based new production in the Arabian Sea Sept 2002 Nitrate fields generated using MODIS Terra Chl a and SST Goes et al., EOS (2004)
ARABIAN SEA WIND FIELDS Sea surface winds reverse direction seasonally Development and intensity regulated by thermal gradient between land and sea Winds responsible for convective mixing during winter monsoon and coastal upwelling during summer monsoon
WINTER MONSOON HIGH LOW 0.1 0.5 1.0 2.0 5.0 10.0 20.0 Schematic showing snow cover extent and wind direction superimposed on an ocean color chlorophyll image for the northeast monsoon season (Nov-Feb).
NITRATE INPUTS IN THE ARABIAN SEA DUE TO WINTER CONVECTIVE MIXING DURING NORTHEAST MONSOON
LOW HIGH 0.1 0.5 1.0 2.0 5.0 10.0 20.0 SUMMER MONSOON Schematic showing the reversal in wind direction during the southwest monsoon (Jun-Sept), superimposed on satellite derived chlorophyll fields
Nitrate (mm) NITRATE INPUT DUE TO UPWELLING DURING THE SOUTHWEST MONSOON
INTERANNUAL CHANGES IN SEA SURFACE NITRATE CONCENTRATIONS DURING THE SW MONSOON Nitrate (mm) Goes et al. (2005) - Science
MORE SNOW WEAKER LAND SEA PRESSURE GRADIENT LESS PHYTO WEAKER SW MONSOON WINDS SEA COLDER LANDMASS WEAKER UPWELLING LESS SNOW STRONGER LAND SEA PRESSURE GRADIENT STRONGER SW MONSOON WINDS MORE PHYTO SEA WARMER LANDMASS STRONGER UPWELLING HIGHER ALBEDO LOWER ALBEDO Schematic showing the response of the Arabian Sea to more and less snow cover
YEAR Anomalies (departures from monthly means for period between 1996-2002) of Eurasian Snow Cover (x106 km2). Trend line shown in bold is 14 point moving average.
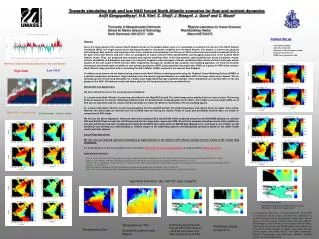
NSIDC SNOW COVER TRENDS Annual snow cover trends suggest a marked decrease in snow accumulation north of the Arabian Sea. May snow cover trends are largely negative all over Eurasia reflecting an earlier and stronger spring melt-off.
Trend line (14 point moving average) showing anomalies (departures from monthly means) of snow cover extent over Southwest Asia and Himalayas-Tibetan Plateau between 1967 and 2003. Note especially the runaway decline in snow cover extent after 1997.
Eurasian-Land Warming The warming of SW Eurasia echoes the global-land signal, though recent warm anomalies are >50% larger than for the global temperatures.
YEAR Left Panel - TMI derived SST in the Arabian Sea showing upwelling and offshore advection of cooler upwelled waters during the SW monsoon (July) of 2003. Arrows indicate wind vectors for the same month. Right top panel – Interannual variability of Wind Speed and Wind Stress Curl. Right bottom panel – Decrease in SST along the coast of Somalia
Interannual changes in chlorophyll along coast of Somalia since 1997
YEAR Annual trends of satellite derived chlorophyll a and zonal wind stress in the offshore western Arabian Sea.
Scatter plots showing the impact of the decline in Eurasian snow on phytoplankton in the Arabian Sea
Sept. 1997 Sept. 2003 Enhanced eutrophication Spread of Anoxia? Fish Mortality Enhanced Denitrification? Rainfall
OUTSTANDING SCIENCE QUESTIONS FOR THE ARABIAN SEA Identify salient coherent climate signals and synthesize these observations into a coherent diagnosis of climate variability Examine impact on phytoplankton community structure and carbon flux associated with changing strength of the monsoons. Examine impact on the Arabian Sea’s Oxygen Minimum Zone Examine impact on Coastal Fisheries Examine impact on rainfall over Indian subcontinent
ACKNOWLEDGMENT This work is being sponsored by NASA, USA “Nothing in the sea falls haphazard; if we cannot predict, it is because we do not know the cause, or how the cause works..." Henry Bryant Bigelow