Download
1 / 36
360 likes | 377 Views
Learn about the HyGIS-QUAL2E system developed by Chungbuk National University in Korea. This user-friendly model coupling GIS with environmental analysis facilitates efficient data input, processing, and output display.

E N D
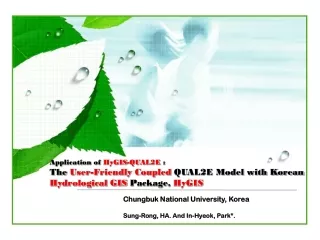
Application of HyGIS-QUAL2E :TheUser-Friendly Coupled QUAL2E Model with Korean Hydrological GIS Package, HyGIS Chungbuk National University, Korea Sung-Rong, HA. And In-Hyeok, Park*.
Contents HyGIS-QUAL2E System I. Introduction II. Design Concepts and Algorithms III. Development & Paradigm IV. Conclusion
Introduction • Background • Requirements of environmental models can estimate and analysis environmental change are increasing, • To estimate the change using models, processes that are collecting concrete and a lot of parameters are needed • Preparation of the model parameters takes long time and techniques trained. • Focused on being able to carry out modeling effectively, it is necessary to minimize time required for collecting input data and analyzing the data. • For offering convenient modeling conditions, • Ensure the scientific technologies getting spatial information for applying model to real-world • Minimize the process that create input file and display output file
Introduction • Objective • Overcome handicaps of traditional method developed for coupling GIS with environmental model • It can be ensured the objectivity and scientific processes • Development of knowledge-based water-quality- evaluative system that coupling HyGIS with Qual2e model
Introduction • Scope • Development of HyGIS-Qual2E system use the HyGIS that is specified on characteristics of Korea’s watershed • It is divided into pre-processing and post-processing • Pre-Processing • Automatically calculating the parameters for modeling-> creating input file • Post-Processing • Development of module to display the result of modeling • Development of Calibration and verification module to control re-action parameters
Introduction • Scope Component-based decision-making system It can be connected with variable analysis system User-friendly system Relational Database based system • Standardization of modeling process • Minimizing processes and check the result in real time • Using data ware house that include hydraulic, hydrological and spatial information • To control the datum effectively, DB is designed to be relational • Coupling system GIS with Environmental model • No need additional processes Coupling system
Introduction • HyGISTM(Hydrological Geographic Information System) • A GIS-based system specified on the Korea characteristics of watershed • Easy constructing the required spatial information • Easy analyzing the topography of stream • Database system • A Based system for developing application • This engine is based on GEOMania™ package <Concepts Diagram of HyGISTM>
Qual2E Introduction • A steady-state water analysis program based on the uniform flow consumption • The study river has to be divided into several consecutive reaches • Reaches are divided into the elements with the same spatial step for calculation • Elements are control volume have same hydraulic characteristic • The Reach have catchments supplied water and pollution load from tributary • Delivery pollution loads allocate the reach from catchments <Qual2E Constituent Interactions>
Development Design the module (function) Design the Concept Structural analysis Introduction • Order of Development Using programming language Create Database Debugging & test Design modules Design functions Design database Standardization Design data flow Strategy for developing Analysis input file Analysis output file Classification Define data flow
Design concepts and algorithms • Structural analysis- Input File Qual2E Input Data 표제 자료 Hec-Ras Basic information for modeling Control data BOD, DO, N, P, Algae Various parameters Parameters of temperature temperature Hec-Ras Length and condition of reaches Reach information Hec-Ras Data of catchments of each reach Catchments Data of incremental Incremental Hec-Ras Hydraulic parameters Hydraulic parameters Re-action parameters of BOD, DO, N, P, Algae Reaction parameters Initial condition of Temp, BOD, DO, N, P, Algae Initial condition II Delivery Coeff. Incremental information of BOD, DO, N, P, Algae Initial condition III Input data Information of junction Junction Headwater Headwater GIS Data Point pollution Information of pollution Parameters of re-aeration Re-aeration GIS Data Datum of climate climate
Users defined Automatic Result of HEC-RAS The user GIS Point source pollution Spatial information Title data Information of elements Catchments of reach Control Various parameters Hydraulic parameters Control data Parameters of Temp. Incremental data Using delivery coeff. Re-action parameters Initial conditions Junction incremental of BOD, DO Headwater Re-aeration Design concepts and algorithms • Structural analysis- Classification
Design concepts and algorithms • Structural analysis- Flexible coupling Scheme • Develop the special interface program to connect simulation models of water quality and GIS software • One who has lack of GIS knowledge can use the system easily • Needed Time to develop is of brief duration • GIS and environmental model can be used independently InputFile (Automatic) GIS Middle Processor Env. Models DBMS Pre-processor Value Post-processor OutputFile (Automatic)
Design concepts and algorithms • Structural analysis - Concept sketch of hyGIS-QUAL2E HyGIS Output file HyGIS-QUAL2E QUAL2E Input file & Spatial information Data warehouse
Design concepts and algorithms • Design the concept – Standardization Qual2E Modeling Input Data Strategies of Development DEM, Agree Burn DEM Flow Direction & Accumulation Mainstream • Using Component of HyGIS Building stream network DIVISION SECTION Division reach Import the Hec-Ras result Coordinate of reach Length of mainstream Coordinate of element Layers for defining property of element Coordinate of reach Starting/ending coordinate of mainstream • Save the result of Hec-Ras on the HyGIS-DB • Calculate a length of mainstream • Reach division considering length • Finding element which is the shortest length between members of layer and mainstream • After designating headwater, Divide a watershed using coordinate of reach Define hydrological coeff. per reach Division element Define prosperities of element Tracking the outlet point of pollusion Sub-catchment division Calculate of Using Divided Watershed Assignment of delivered pollution using overlaying watershed layer and pollution layer DELIVERY COEFF. Overlaying the watershed maps • sf, Area • Layer of pollution load • Watershed map N.P.S load per provinces Calculating delivery coeff. Distribution of water quantity using watershed area Allocation of water quantity Watershed map, Area M O D E L I N G Create input file Create a input file for modeling using HyGIS-DB Receiving parameter, modifying the input file Calibration & verification using output of modeling Input file for Modeling Parameter of Modeling output file of Modeling Create diagram Calibration/Verification, chart
HyGIS Qual2E Model Ext. Data (ASCII) Non-Spatial Data Middle Processor Data Warehouse Pre-Processor DB DB DB Building stream network P.S. load into element Spatial Data Input Data Division reach Sub-catchments division Input Data DB V A L U E DB DB Calculation of Delivery coeff. Definition of Hydrological Coefficient per Reach Allocation of water quantity Element division Simulation Model Post-Processor Create input file Input Data Output Data Calibration/Verification, chart Hec-Ras Input Data Delivery Coefficient Input Data Design concepts and algorithms • Design the concept – Structural design
Design concepts and algorithms • Design the Module – Division Reach • Height and Velocity are calculated Using Hec-Ras • Input data : a section of stream, water quantity 3 set or more per section • Draw the dispersion of Q-V, Q-H per a section • All of the Reach have same hydraulic condition • Hydraulic coefficients per Reach apply to Qual2E <Q-V, Q-H Rating Curve>
Design concepts and algorithms • Design the Module – Division Element • Calculating the length of Reach along the direction of stream (Lreach) • Saving length of Element defined by users(Lelement) • Divided number of Element per (Ei) = Lreach/Lelement • After reiterating the calculation as the number of Reach, Calculating the total number of element(ΣEi) • Mediated Length of Element=Lstream/ ΣEi • Define the prosperities of Element(Headwater, Junction, etc.) Reach Element Element Element Element E The element is divide into five Length of element
1 1 2 2 3 3 4 4 Design concepts and algorithms • Design the Module – Division watershed • Using the outlet point of reach, watershed is divided • Spatial information about divided watershed and entire watershed are calculated and saved. DEM Grid Creating outlet point Transferring data Division watershed
Define the delivery coefficientPM = PO × K K = e -Φ· Sf 면적 Lk Calculation of regressive equation L Delivery coefficient, K calculate using value of Sf and Φ Kg/d/L = Kg/d/m (Kg/d/m) × Lk = discharged pollution (Kg/d/m) × Lk ×K = delivered pollution Calculating the delivery pollution load using K Design concepts and algorithms • Design the Module – Calculation of N.P.S. pollution load • Calculating of discharged pollution load per catchments • Overlaying divided watershed map and province map-> calculating the area of province in catchments • Using ratio of the area and unit pollution load of province, discharged pollution load is calculated
Design concepts and algorithms • Design the Module – Calculation of P.S. pollution load • Tracking the outlet point of pollution on the stream and allocating the pollution load on the element Flow accumulation DEM Flow direction TAV Calculating Threshold Accumulation value Extracting Outlet Point
Design concepts and algorithms • Design the Module – Calculation of pollution loads Allocating the pollution on catchments Calculating pollution loads <tracking the P.S. pollution using Flow Path <Watershed> <Pollution Loads> <Overlaying> • Using overlaying watershed map and pollution load map • Delivery coefficients are taken role in each catchments as a weight <allocation N.P.S. pollution loads using overlaying maps
Design concepts and algorithms • Data Model Spatial Data model Non-Spatial Data model
QUAL2E Modeling Dataware House Output Data Input Data DB DB DB DB DB DB Q U A L 2 E Input File (ASCII) Transfering Process Output File (ASCII) Display the result Result of modeling Re-action parameters Calibration/Verification Re-action parameters K1, K3, K4 OK? NO Yes END Design concepts and algorithms • Algorithm
Development & paradigm <Division Reach> <Reach 분할 UI> <Division Reach UI>
Development & paradigm <Division Element> <Division ElementUI>
Development & paradigm <allocating and tracking pollution> <allocating and tracking pollution UI>
Development & paradigm Figure 13) Create watershed Grid to Polygon <Division Watershed> <Overlaying Analysis>
Development & paradigm <Calculating discharged pollution> <Calculating delivery coefficient>
Development & paradigm <Allocating flow>
Development & paradigm <Created input file> <Creating input file UI>
Development & paradigm <Calibration/Verification> <Modification of re-action parameters>
Development & paradigm <Result Viewer>
Conclusion • This research aims to develop a program HyGIS-Qual2E by which an input data file of the river water quality model can be prepared automatically • HyGIS-QUAL2E is water quality analysis system based on DBMS • Because DB is established relationally, Datum can be managed and transferred effectively • It is not necessary additional process, probability of occurring errors and spending time for modeling will be decreasing.
Conclusion • Gives the model users to be convenient handling of the model • Suggest the established rule for preparation • Users can cope with the difficulties to expend the utilities of the program to wider