Download

1 / 24
240 likes | 259 Views
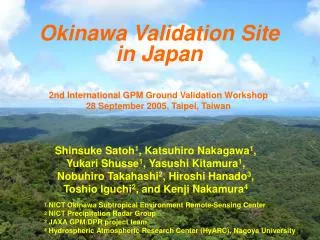
Okinawa Validation Site in Japan. 2nd International GPM Ground Validation Workshop 28 September 2005, Taipei, Taiwan. Shinsuke Satoh 1 , Katsuhiro Nakagawa 1 , Yukari Shusse 1 , Yasushi Kitamura 1 , Nobuhiro Takahashi 2 , Hiroshi Hanado 3 , Toshio Iguchi 2 , and Kenji Nakamura 4

E N D
Okinawa Validation Site in Japan 2nd International GPM Ground Validation Workshop 28 September 2005, Taipei, Taiwan Shinsuke Satoh1, Katsuhiro Nakagawa1, Yukari Shusse1, Yasushi Kitamura1, Nobuhiro Takahashi2, Hiroshi Hanado3, Toshio Iguchi2, and Kenji Nakamura4 1 NICT Okinawa Subtropical Environment Remote-Sensing Center 2 NICT Precipitation Radar Group 3 JAXA GPM/DPR project team 4 Hydrospheric Atmospheric Research Center (HyARC), Nagoya University
Outline of the talk (1) Introduction of three main remote-sensors in NICT Okinawa, Japan - Okinawa GV site located in subtropical maritime environment - Long-Range Ocean Radar (LROR) - 400 MHz-band Wind Profiler (WPR) - C-band polarimetric radar (COBRA) (2) Application studies for TRMM/GPM GV - Okinawa Baiu Campaign Experiment 2004 (Okn-Baiu04) - DSD profile retrieval from 400 MHz WPR and other instruments - Rainfall type classification using COBRA polarimetric data - Comparison between TMI data and TB simulated from COBRA data NICT: National Institute of Information and Communications Technology (former name is CRL: Communications Research Laboratry)
45N 40N 35N 30N Kuroshio Current Asia Monsoon OkinawaMain Island 25N Ishigaki and Yonaguni Is. Typhoon Okinawa located in the sub-tropics Okinawa is a good observation base in the subtropical maritime environment. - Heat and water provided by Typhoon - High temperature sea water provided by the Kuroshio current - Water circulation in the east Asia Monsoon Typhoon
Three Remote-sensors in NICT Okinawa 400 MHz-band Wind Profiler Ocean Radar 海 風 Ogimi WPR Facilities Weather Radar (COBRA) :AWS 雨 Ogimi Yonaguni Ocean Radar Facilities Onna Nago Zamami Yonaguni Ishigaki Okinawa Subtropical Environment Remote-Sensing Center Nago Radar Facilities Network Data System
1st scattering 2nd scattering Long-range Ocean Radar < LROR Specificatons > Radar Type FMICW Doppler Radar Frequency 9.2 MHz Band Width 55 kHz, 22 kHz Tx Power 1 kW (Peak) Obs. Range 200 km Range Resolution < 7 km Antenna Type 16 elements array for DBF Beam Width 8 – 10 degrees Obs. Area 60 degrees Obs. Interval > 30 min Yonaguni Radar Facilities First scatter signal current speed, wind direction Second scatter signal wave height Frequency of Bragg scattering Ishigaki Radar Facilities
Observation Range of the LROR Kuroshio current 200 km TAIWAN Ishigaki radar site Yonaguni radar site 11 Oct. 2004, 14:00JST 05 Nov. 2004, 08:30JST
400 MHz-band Windprofiler < 400 MHz WPR Specificatons > Radar Type Pulsed Doppler Radar Frequency 443.0 MHz Peak Power 20 kW Average Power 2 kW Pulse Length 1.33 / 2.0 / 4.0 us PRF 6.25 / 20 kHz Antenna Type 24 x 24 element crossed array Antenna Size 10.4 x 10.4 m Beam Width 3.3 deg Beam Steerability AZ 0 - 360 deg EL 0 - 15 deg • < Other instruments at Oogimi > • 1.3 GHz-band Windprofiler • 1357.5MHz, 1 kw (peak), 2.1 x 2.1 m • Doppler Sodar • GPS sonde • Ceilometer • Automatic Weather Station • Optical Rain Gage • Micro Rain Radar • 2D Video Distrometer Oogimi Windprofiler Facilities DopplerSodar 1.3 GHz WPR 400 MHz WPR
Horizontal Winds Profiles 18 (Typhoon Songda 2004) m/s 16 14 12 HIGHT (km) 10 8 6 4 2 00 (SEP05) 06 12 18 00 (SEP06) 06 12JST 12 11 10 9 8 7 6 5 4 3 2 1 (01APR – 02APR2004) m/s HIGHT (km) 12 12 06 18 00 06 18 00 24JST
C-Band Okinawa Bistatic polarimetric RAdar (COBRA) < COBRA Specifications > Frequency 5340 MHz Peak power 250 kW×2 (Klystron)10 kW×2 (TWTA) COBRA+ Pulse width 0.5 / 1.0 / 2.0 s (Klystron)0.5 - 100 s (TWTA) COBRA+ PRF 250-3000 Hz, PRT 1 s step staggered PRF Antenna 4.5 m parabola Antenna gain 45 dBi (inc. radome) Beam width 0.91 deg Sidelobe level < -30 dB (AZ dir., one way) < -28 dB (EL dir., one way) Cross pol ratio > 36 dB (integ in a beam) Tx Polarization H / V / +45 / -45 / LC / RC Doppler estimation Pulse-pair / FFT Range bin num > 2000 Antenna scan 0.5-10 rpm (PPI) 0.1-3.6 rpm (RHI) COBRA was installed on a mountain peak (343 m in ASL + 15 m tower) in Nago city, Okinawa Island.
Back- scatter Bistatic scatter 3D windobs area 150 km Characteristic Functions of COBRA Bistatic Doppler Network Transmitting 6 kinds of polarization (H, V, +45, -45, RC, LC) pulse by pulse, and receiving H and V simultaneously Dual-Doppler analysis using main radar and bistatic receiver Zamami bistatic site (since Mar. 2005) Zamami • Attenuation correction • Precip. type classification • DSD estimation Polarization Data
Typhoon Observation by COBRA 12km 8km 4km 0km 250km 300km 100km 150km 200km 0km 50km 400km T0418 (SONGDA) 400km T0216 (SINLAKU) GMS IR Image
Okinawa Baiu Campaign ExperimentOkn-Baiu-04 (May 22 - June 9, 2004) Collaborated IOP experiment with - CREST-GSMaP (Osaka prefec univ)- CREST-LAPS (Nagoya Univ) <OBJECTIVES>4D-dataset of rain rate, DSD and hydrometeor type, etc for development and validation of satellites-based precipitation map Simultaneous obs with TRMM and Aqua 400 MHz WPR Doppler Sodar MP-Ka COBRA volume scan COBRA RHI scan Ogimi site < Ogimi WPR site > - Disdrometer - Micro Rain Radar (MRR) - 2D Video Distrometer (2DVD) - Optical Rain Gauge (ORG) - Microwave Radiometer (MWR) - Ceilometer - Doppler Sodar - Auto Weather Station (AWS) X-band Doppler Radarby Nagoya-univ. GPS Sonde Ka-band Doppler Radar by NIED
10 H=2519 m 1 Rain Echo 0.1 S OBS 0.01 S T S *S Turbulence Echo (Air motion) 0.001 D T S D 0.0001 -10 -8 -6 -4 -2 0 Velocity (m/s) DSD profile retrieval from 400 MHz WPR data (1) 21:36JST, 01JUN 2004 Sobs(v)=PtSt(v)+SD(v)*St(v)+Pn Pt :Received Power from turbulence SD(v): Doppler spectrum of raindrop Pn :Noise level * :Convolution integral Turbulence echo spectrum St(v) is fitted by Gaussian function (V0 and are estimated) SD(v)=C・N(D)・D6・dD/dv DSD Falling Velocity of Raindrop (Gunn and Kinzer): V=9.65 - 10.3exp(-0.6D) by Yasushi Kitamura
DSD profile retrieval from 400 MHz WPR data (2) Drop Size Distribution < H=4 km -:WPR○:COBRA Above the melting level, turbulence echo cannot be distinguished from snowfall echo > H=4 km Air motion: V0=0 Sobs(v)=C・N(D)・D6・dD/dv Snow falling vel:
Comparison between DSDs derived from 400 MHz WPR and MRR MMR: 1275 m WPR: 1223 m 10 min average DSD measurement 15 4 400 MHz WPR HEIGHT (km) 1 MRR 2DVD / Disdrometer on the ground
3D Characteristics of Polarimetric Radar Variables (1) Stratiform Convective Embedded by YukariShusse
3D Characteristics of Polarimetric Radar Variables (2) < Zhh vs ZDR > Stratiform Type Convective Type Embedded Type EL=3.4° EL=2.6° BB EL=2.0° EL=1.4° EL=0.9° EL=0.5° Upper layer: lower ZDR (1~1.5) in spread Zhh Lower layer: higher ZDR (>2.5) in spread Zhh Upper layer: Lower ZDR in small Zhh Lower layer: higher ZDR with larger Zhh > 4 km: relative lower ZDR ~ 4 km: weak correlation < 4 km: ZDR increase with Zhh
3D Characteristics of Polarimetric Radar Variables (3) < Zhh vs hv > Stratiform Type Convective Type Embedded Type BB Spread distribution of larger hv (>0.99) up to upper layer > 4 km: smaller hv ~ 4 km: weak correlation < 4 km: hv increases with Zhh Upper layer: smaller hv Lower layer: larger hv with larger Zhh
TMI TB simulated from COBRA data (1) TRMM • < Procedure > • COBRA R- data converts into the TMI footprint coordinates • (40x60 km, 1x1 km reso.) • RTM calculation (Liu, 1998) • 0C level = 4.5 km (rain/graupel) • Relative humidity = 80% • adjust Z-R relationship • calc in vertical direction • calc in 1x1 km grid • TMI Antenna convolution and TB output COBRA beams Sat. flight dir. Coordinates for TMI footprint COBRA by Nobu Takahashi
TMI TB simulated from COBRA data (2) 10 GHz V-pol 02Z, 2JUN2004 TB10v (TMI) TB10v (COBRA-sim) DIFF DIFF (K) A (Z=AR^B)
TMI TB simulated from COBRA data (3) 19 GHz V-pol 02Z, 2JUN2004 TB19v (TMI) TB19v (COBRA-sim) DIFF (K) A (Z=AR^B)
Okinawa Data Publication Server http://sdkgwww.nict.go.jp/internal.html - Quick-look images for public seeing. - To download the raw data, the user account is required (Ask me: “satoh@nict.go.jp” about an application form for the account). COBRA raw data have not been included on this server The explanation is Japanese only until now
Official Web Pageof NICT Okinawa http://www2.nict.go.jp/dk/c218/ The last data of LROR The last data (LROR, WPR, COBRA) are linked from Japanese page only
Summary • NICT Okinawa developed three main remote-sensor; - Long-range Ocean Radar (LROR)- 400 MHz-band Wind Profiler (WPR)- C-band polarimetric radar (COBRA) • to measure the subtropical maritime phenomena. • All sensors are operated almost continuously until now and in future. • The observation data are published through a web server • Some application studies for the TRMM/GPM algorithm development using the observation data are in progress. • - DSD profile retrieval from WPR data • - Rain type classification using COBRA polarimetric data • - TB simulated from COBRA simultaneous obs data • Site calibration and physical calibration will carry out.