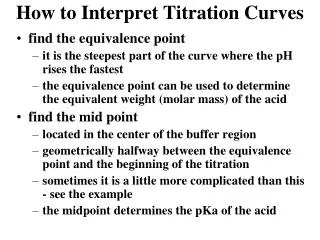
How Pros Interpret PCR Charts
0 likes | 1 Views
Pros interpret Put-Call Ratio (PCR) charts to gauge market sentimentu2014high PCR often signals bearishness or oversold conditions, while low PCR suggests bullishness or overbought levelsu2014helping them anticipate potential trend reversals or continuations.

How Pros Interpret PCR Charts
E N D
Presentation Transcript
Read blog - https://navia.co.in/blog/how-pro-traders-use-put-call-ratio-pcr-charts/ How Pros Interpret PCR Charts?
What’s the Put-Call Ratio (PCR)? Read blog - https://navia.co.in/blog/how-pro-traders-use-put-call-ratio-pcr-charts/ • The Put-Call Ratio (PCR) compares the volume or open interest of put options to call options, serving as a barometer of market sentiment. • PCR > 1.0 typically indicates bearish sentiment (more hedging/fear). • PCR < 1.0 suggests bullish sentiment (more optimism or risk-taking). • Extreme values often act as contrarian signals—extreme fear (high PCR) might precede market rallies, while extreme optimism (low PCR) may signal market tops
Charting PCR Like a Pro Read blog - https://navia.co.in/blog/how-pro-traders-use-put-call-ratio-pcr-charts/ • Pro traders visualize PCR as they would stock prices: • Collect daily PCR values — for indices like Nifty or individual stocks. • Plot line or area charts to track movements over time. • Overlay PCR with price charts to correlate sentiment shifts with price actions. • Navia, and other platforms offer built-in PCR charting tools
Read blog - https://navia.co.in/blog/how-pro-traders-use-put-call-ratio-pcr-charts/ Reading PCR Extremes for Trading Edges • Use PCR chart trends to identify potential market inflection points: • PCR > 1.5 → Excessive bearishness, often treated as contrarian buy signal (possible rally ahead). • PCR < 0.6 → Signs of over-optimism or complacency, possibly leading to a market correction
Read blog - https://navia.co.in/blog/how-pro-traders-use-put-call-ratio-pcr-charts/ Putting It All Together — Trading with PCR + Price • When PCR falls from ~0.75 to ~0.60, while prices are still trending upward, it may indicate a short-term correction, even within a broader bullish trend (e.g., Navia’s intraday example from June 19, 2025) • Pro traders blend PCR insights with price dynamics to refine timing for entering or exiting trades—balancing sentiment extremes with observed price behavior.
Disclaimer Investment in securities market are subject to market risks, read all the related documents carefully before investing. The securities quoted are for illustrative purposes and are not intended as recommendations. Brokerage will not exceed the SEBI prescribed limit. Navia Markets Ltd ,SEBI Registration No.INZ000095034-NSE Member code for CM, FAO & CD: 07708 - BSE Clearing No. for CM, FAO & CD: 6341-MCX Member ID: 45345 NSDL DP ID: IN300378-CDSL DP ID: 12086500-SEBI Registration No. for DP: IN-DP-311-2017-GST Registration number :33AAACM4739R2ZZ-Registered office: Ganga Griha, 4th & 5th Floor, No.9, Nungambakkam High Road, Chennai - 600 034 Email ID: ig@navia.co.in - Contact No: +91 70100 75500 https://bit.ly/naviadisclaimer Read blog - https://navia.co.in/blog/how-pro-traders-use-put-call-ratio-pcr-charts/