Download
1 / 1
10 likes | 200 Views
Statistically significant (happens by chance less than 5% of the time). 6%. 4%. How often difference between Jar A and Jar B occurred. Statistical noise. 2%. 0%. 0. 20. 10. 10. 20. More drawn from Jar B. Same number of gray marbles drawn from Jar A and Jar B. More drawn

E N D
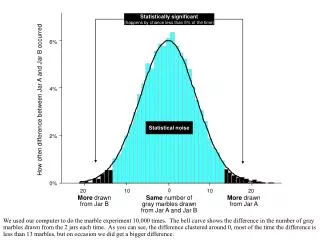
Statistically significant(happens by chance less than 5% of the time) 6% 4% How often difference between Jar A and Jar B occurred Statistical noise 2% 0% 0 20 10 10 20 More drawn from Jar B Same number of gray marbles drawn from Jar A and Jar B More drawn from Jar A We used our computer to do the marble experiment 10,000 times. The bell curve shows the difference in the number of gray marbles drawn from the 2 jars each time. As you can see, the difference clustered around 0, most of the time the difference is less than 13 marbles, but on occasion we did get a bigger difference.