Download
1 / 12
120 likes | 135 Views
Study on protein expression and phosphorylation levels in T-ALL cell lines after exposure to AUY922 and daunomycin, evaluating cell viability, apoptosis, and TUNEL positivity. Results indicate significant effects on cell lines.

E N D
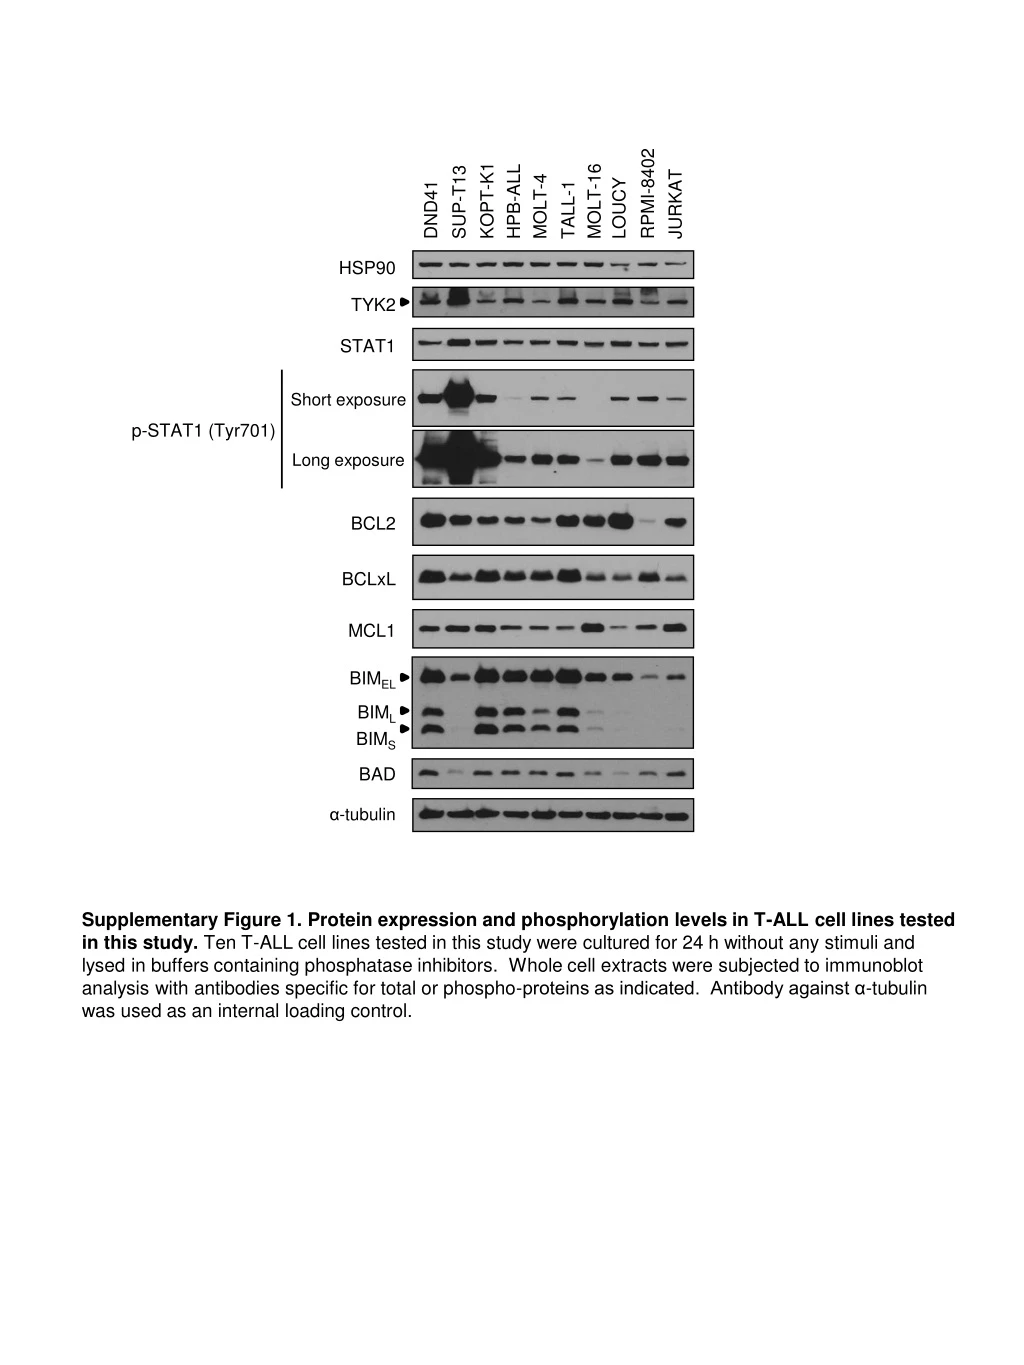
RPMI-8402 HPB-ALL DND41 MOLT-16 LOUCY SUP-T13 KOPT-K1 MOLT-4 TALL-1 JURKAT HSP90 TYK2 STAT1 Short exposure p-STAT1 (Tyr701) Long exposure BCL2 BCLxL MCL1 BIMEL BIML BIMS BAD α-tubulin Supplementary Figure 1. Protein expression and phosphorylation levels in T-ALL cell lines tested in this study. Ten T-ALL cell lines tested in this study were cultured for 24 h without any stimuli and lysed in buffers containing phosphatase inhibitors. Whole cell extracts were subjected to immunoblot analysis with antibodies specific for total or phospho-proteins as indicated. Antibody against α-tubulin was used as an internal loading control.
IC50 (nM) < 10.0 < 10.0 < 10.0 < 10.0 < 10.0 < 10.0 < 10.0 < 10.0 < 10.0 17.0 AUY922 (nM) Supplementary Figure 2. Cell viability of human T-ALL cell lines after 96 h exposure to AUY922. T-ALL cell lines were cultured with graded concentrations of AUY922 for 96 h. Cell viability values are mean ± s.d. percentages of the untreated control value in triplicate experiments. The IC50 value of each cell line in this assay is indicated on the right.
DND41 SUP-T13 KOPT-K1 HPB-ALL MOLT-4 TALL-1 MOLT-16 LOUCY RPMI-8402 JURKAT 10 4 10 4 10 4 10 4 10 4 10 4 10 4 10 4 10 4 10 4 10 3 10 3 10 3 10 3 10 3 10 3 10 3 10 3 10 3 10 3 10 2 10 2 10 2 10 2 10 2 10 2 10 2 10 2 10 2 10 2 DMSO FL3-H FL3-H FL3-H FL3-H FL3-H FL3-H FL3-H FL3-H FL3-H FL3-H 10 1 10 1 10 1 10 1 10 1 10 1 10 1 10 1 10 1 10 1 10 0 10 0 10 0 10 0 10 0 10 0 10 0 10 0 10 0 10 0 10 4 10 4 10 4 10 4 10 4 10 4 10 4 10 4 10 4 10 4 10 3 10 3 10 3 10 3 10 3 10 3 10 3 10 3 10 3 10 3 AUY922 30 nM PI 10 2 10 2 10 2 10 2 10 2 10 2 10 2 10 2 10 2 10 2 FL3-H FL3-H FL3-H FL3-H FL3-H FL3-H FL3-H FL3-H FL3-H FL3-H 10 1 10 1 10 1 10 1 10 1 10 1 10 1 10 1 10 1 10 1 10 0 10 0 10 0 10 0 10 0 10 0 10 0 10 0 10 0 10 0 Annexin V-FITC Supplementary Figure 3. Apoptotic change of T-ALL cell lines after AUY922 treatment. T-ALL cell lines were treated with DMSO or 30 nM of AUY922 for 72 h, and assessed for apoptosis by flow cytometric analysis following Annexin V-FITC and PI double staining. The panels show two-dimensional dot plot images. Blue rectangles indicate the fractions of Annexin V-positive / PI-negative early apoptotic cells, while red rectangles indicate the fractions of Annexin V-positive / PI-positive late apoptotic cells. Quantification of apoptotic cells in triplicate experiments is shown in Figure 2.
a DND41 SUP-T13 KOPT-K1 HPB-ALL MOLT-4 TALL-1 MOLT-16 LOUCY RPMI-8402 JURKAT 2.1% 1.0% 0.1% 2.8% 1.0% 2.0% 0.6% 2.5% 0.9% 1.0% TUNEL DMSO PI Count PI 16.0% 22.6% 87.4% 48.1% 28.6% 4.5% 11.4% 7.5% 10.4% 5.7% TUNEL AUY922 30 nM PI Count PI b *** TUNEL-positive cells (%) ** *** ** ** * ** * ** * Supplementary Figure 4. TUNEL positivity and cell-cycle distribution of T-ALL cell lines after AUY922 treatment. (a) T-ALL cell lines treated with DMSO or 30 nM of AUY922 for 48 h were fixed, and assessed for apoptosis and cell-cycle distribution by flow cytometric analysis after TUNEL and PI double labelling. For each cell line, upper panel shows two-dimensional dot plots image, while the lower panel shows a PI histogram. The percentage of TUNEL-positive cells is shown in each of the upper panels. (b) Quantification of TUNEL-positive cells. Values represent mean ± s.d. percentages of TUNEL-positive cells in duplicate experiments. *, P < 0.05; **, P < 0.01; ***, P < 0.001 by two-sample, two-tailed t test.
Daunomycin 0.3μM JURKAT Control vector JURKAT BCLxL JURKAT MCL1 JURKAT BCL2 Supplementary Figure 5. Cell viability of the specific JURKAT cells overexpressing each of antiapoptotic BCL2 family proteins after daunomycin treatment. The JURKAT cells overexpressing BCL2, BCLXL, or MCL1, or infected with control vector were treated with 0.3 µM of daunomycin for 48 h. Cell viability values are shown as mean ± s.d. percentages of the untreated control value in triplicate experiments.
a b JURKAT Control vector JURKAT BCL2 JURKAT BCLxL JURKAT MCL1 ** 0.6% 1.3% 0.7% 1.3% ** DMSO ** 11.7% 1.3% 9.5% 14.3% AUY922 30 nM TUNEL JURKAT Control Vector JURKAT BCL2 JURKAT BCLxL JURKAT MCL1 PI Supplementary Figure 6. TUNEL positivity of the specific JURKAT cells overexpressing each of antiapoptotic BCL2 family proteins after AUY922 treatment. (a) The JURKAT cells overexpressing BCL2, BCLXL, or MCL1, or infected with control vector were treated with DMSO or 30 nM of AUY922 for 48 h. These cells were fixed and assessed for apoptosis by flow cytometric analysis following TUNEL/PI double staining. The panels show two-dimensional dot plots with the percentage of TUNEL-positive cells in each sample. (b) Quantification of TUNEL-positive cells. Values represent mean ± s.d. percentages of TUNEL-positive cells in triplicate experiments. **,P < 0.01 by two-sample, two-tailed t test.
b a Daunomycin 0.01 μM KOPT-K1 Control vector KOPT-K1 BCL2 KOPT-K1 BCLxL KOPT-K1 MCL1 c KOPT-K1 Control vector KOPT-K1 BCL2 KOPT-K1 BCLxL KOPT-K1 MCL1 AUY922 (nM) 0 10 30 0 10 30 0 10 30 0 10 30 PARP Cleaved PARP α-tubulin d e KOPT-K1 BCLxL KOPT-K1 BCLxL KOPT-K1 BCL2 KOPT-K1 MCL1 KOPT-K1 BCL2 KOPT-K1 MCL1 AUY922 (nM) AUY922 (nM) 0 10 30 0 10 30 0 10 30 0 10 30 0 10 30 0 10 30 TYK2 BCL2 STAT1 BCLxL p-STAT1 (Tyr701) HSP70 MCL1 α-tubulin α-tubulin Supplementary Figure 7. BCL2 overexpression can rescue AUY922-induced apoptosis in KOPT-K1 T-ALL cell line.(a)The KOPT-K1 cells overexpressing BCL2, BCLXL, or MCL1, or infected with control vector were treated with 0.01 µM of daunomycin for 48 h. Cell viability values are shown as mean ± s.d. percentages of the untreated control value in triplicate experiments. Overexpression of each antiapoptotic protein partially rescued daunomycin-induced decrease of viability.(b) These specific KOPT-K1 cells were treated with graded concentrations of AUY922 for 72 h. Cell viability values are shown as mean ± s.d. percentages of the untreated control value in triplicate experiments. BCL2 overexpression was able to partially rescue AUY922-induced decrease of viability. (c) Western blot analysis to examine PARP cleavage in the specific KOPT-K1 cells treated with AUY922. The cells were treated with the indicated concentrations of AUY922 or DMSO control (AUY922 0 nM) for 48 h, and subjected to immunoblot analysis with antibodies specific for PARP and α-tubulin. Overexpression of BCL2, not BCLxL or MCL1, protected the cells from AUY922-induced apoptosis, as indicated by the absence of cleaved PARP. (d) Western blot analysis of specific KOPT-K1 cells treated with the indicated concentrations of AUY922 or DMSO (AUY922 0 nM) for 16 h. AUY922 reduced TYK2 levels and eliminated STAT1 Tyr701 phosphorylation in each of the specific KOPT-K1 cells. (e) Western blot analysis of specific KOPT-K1 cells treated with the indicated concentrations of AUY922 or DMSO (AUY922 0 nM) for 48 h. Expression levels of the BCL2 protein were decreased after AUY922 treatment in BCLxL- or MCL1-overexpressing cells, but was maintained in cells that overexpress BCL2.
a IC50 (µM) 3.74 1.99 5.57 4.08 4.22 5.68 6.23 9.82 0.30 [ABT-199] (µM) b IC50 (nM) 1.20 [ABT-199] (nM) Supplementary Figure 8. Sensitivity of human T-ALL cell lines to ABT-199. (a) T-ALL cell lines were cultured with graded concentrations of ABT-199 ranging up to 30 µM for 72 h. Cell viability values are shown as mean ± s.d. percentages of the untreated control value in triplicate experiments. The IC50 value of each line in this assay is shown on the right. (b) The sensitivity of LOUCY cell line to ABT-199 was independently assessed by treatment with graded concentrations of ABT-199 ranging up to 100 nM for 72 h. The IC50 value is shown on the right.
a b JURKAT BCL2 JURKAT BCL2 SHSY-5Y 293T (kDa) AUY922 (nM) 0 10 30 AUY922 (nM) 0 10 30 (kDa) 35 35 BAK 25 25 BAX 15 15 α-tubulin α-tubulin 50 50 c d JURKAT BCL2 JURKAT BCL2 AUY922 (nM) 0 10 30 AUY922 (nM) 0 10 30 (kDa) (kDa) 25 PUMA (23kDa) 25 BID 15 15 α-tubulin 50 α-tubulin 50 e JURKAT BCL2 AUY922 (nM) 0 10 30 (kDa) 25 BIK 15 α-tubulin 50 Supplementary Figure 9. Effect of AUY922 on the expression levels of proapoptotic BCL2 family proteins other than BIM and BAD in BCL2-overexpressing JURKAT cells. Western blot analysis with whole-cell lysates from BCL2-overexpressing JURKAT cells treated with the indicated concentrations of AUY922 or DMSO (AUY922 0 nM) for 48 h. The samples were immunoblotted for BAX (a), BAK (b), BID (c), PUMA (d) or BIK (e). The protein lysates from SHSY-5Y and 293T cells were used as positive controls for BAX detection.
BIM BAD *** *** *** *** *** *** ** ** *** *** ** ** ** ** *** *** Relative expression level to DMSO-treated cells JURKAT Control Vector JURKAT Control Vector JURKAT BCL2 JURKAT BCLxL JURKAT MCL1 JURKAT BCL2 JURKAT BCLxL JURKAT MCL1 Supplementary Figure 10. BIM and BAD mRNA levels after treatment with AUY922 or ABT-199 in the specific JURKAT cells that overexpress each of antiapoptotic BCL2 family proteins. JURKAT cells overexpressing BCL2 or BCLXL or MCL1, or infected with control vector were treated with 30 nM of AUY922, 5 µM of ABT-199 or DMSO for 48 h. BIM and BAD mRNA expression was measured by quantitative RT-PCR and normalized by GAPDH expression. Expression levels relative to DMSO-treated cells are shown as mean ± s.d. in triplicate experiments. **, P < 0.01; ***, P < 0.001 by two-sample, two-tailed t test.
KOPT-K1 shLuc shBIM#3 shBIM #4 1.7% 1.2% 2.7% DMSO 4.1% 60.9% 3.2% AUY922 30 nM TUNEL PI Supplementary Figure 11. TUNEL positivity of KOPT-K1 cells transduced with BIM-targeting shRNA after AUY922 treatment. KOPT-K1 cells transduced with each of BIM-targeting shRNAs (shBIM #3 and #4) or a control shLuc were treated with DMSO or 30 nM of AUY922 for 36 h. These cells were fixed and assessed for apoptosis and cell-cycle distribution by flow cytometric analysis following TUNEL/PI double labeling. The panels show two dimensional dot plots with the percentage of TUNEL-positive cells in each sample. Quantification of TUNEL-positive cells in triplicate experiments is shown in Figure 7c.
b a JURKAT shBIM #3 shBIM #4 shLuc (kDa) 25 BIMEL BIML 15 BIMS 10 (Short exposure) BIMEL α-tubulin c JURKAT shLuc shBIM #3 shBIM #4 AUY922 (nM) 0 30 0 30 0 30 (kDa) 25 BIMEL BIML 15 BIMS 10 (Short exposure) BIMEL TYK2 STAT1 p-STAT1 (Tyr701) BCL2 BAD PARP Cleaved PARP α-tubulin Supplementary Figure 12. BIMshRNA knockdown is not able to rescue AUY922-induced decrease of viability in JURKAT cells.(a)BIM was silenced by lentiviralshRNA knockdown in JURKAT cells and protein expression was assessed by western blotting. Two independent shRNAs (shBIM #3 and #4) were compared with a control shRNA targeting luciferase (shLuc). (b)JURKAT cells transduced with each of BIM-targeting shRNAs (shBIM #3 and #4) or a control shLuc were treated with graded concentrations of AUY922 for 48 h. Cell viability values are shown as mean ± s.d. percentages of the untreated control value in triplicate experiments. (c) JURKAT cells transduced with each of BIM-targeting shRNAs (shBIM #3 and #4) or a control shLuc were treated with 30 nM of AUY922 or DMSO (AUY922 0 nM) for 36 h. Whole-cell extracts were analyzed by immunoblotting with each specific antibody.