Download
1 / 39
420 likes | 659 Views
The Chemical Water Quality of Lake Nipissing 2003-2004. Andrew Paterson Dorset Environmental Science Centre Environmental Monitoring and Reporting Branch Ontario Ministry of the Environment. Canadian Shield. Ontario’s Inland Lakes. ~260,000 lakes majority on Canadian Shield

E N D
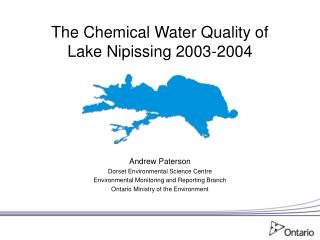
The Chemical Water Quality of Lake Nipissing 2003-2004 Andrew Paterson Dorset Environmental Science Centre Environmental Monitoring and Reporting Branch Ontario Ministry of the Environment
Canadian Shield Ontario’s Inland Lakes • ~260,000 lakes • majority on Canadian Shield • water quality is generally good • ↑ water quality = ↑ value
“A lake is the landscape’s most beautiful and expressive feature. It is earth’s eye; looking into which the beholder measures the depth of [his] own nature.” - Henry David Thoreau (Walden)
The economic value of good water quality in Ontario • ~2 million adult anglers per year • $1.7 billion on goods related to fishing • residents own ~1.2 million recreational boats • 5.6 million visitors engaged in resource-based tourism • (50% participating in water sports, 39% hunting/fishing) • $1.1 billion in spending from resource-based tourism • commercial fisheries (~$42.5 million) (Multiple sources, 1998, 1999, 2002, 2003: Min. Natural Resources, Provincial Auditor of Ontario, Min. Tourism and Recreation)
Background • In 2002, MOE Northern Region staff submitted a request to the Environmental Monitoring and Reporting Branch (EMRB) to undertake a water quality survey of Lake Nipissing • Surveys had been completed in 1971, 1974 and 1975 (no summary report), and 1988, 1989 and 1990 (Neary & Clark 1992)
Background • EMRB staff at Dorset coordinated a volunteer-based sampling program for 2003 and 2004 • Results of this survey were compiled and compared with the 1988-90 survey in a report co-authored by Clark, Paterson, DeSellas & Ingram (2010)
Clark, Paterson, DeSellas & Ingram (2010) 57 pp. Neary & Clark (1992) 66 pp.
49% 45% 5% Lake Nipissing ~82,200 ha 5 Lake Nipissing and its watershed Watershed area : Lake area = ~16 : 1
Methods • In 2003-04 water samples were collected from a series of 26 stations that were originally sampled in the early 1970s and again in 1988-90 • In all 3 surveys, samples were collected during the ice-free season: • in 1988-90 by a Dorset field technician monthly • in 2003-04 by volunteers on a roughly monthly schedule (3 stations were not sampled and the other stations were sampled 5-12 times)
Lake Nipissing showing the 26 stations that were sampled in 1988-90 and re-sampled in 2003-04 (stations 2, 3 and 18 were not re-sampled). Also note that Cache Bay (#7), Callander Bay (#9) and West Bay (#19) are somewhat isolated from the main body of the lake.
Methods • Water chemistry from the 1970s and 1988-90 surveys was analyzed by a commercial lab • Results from the 2003-04 survey were completed by the MOE water chemistry lab at Dorset We know that the commercial lab values for total phosphorus were generally lower than the MOE Dorset lab results.
Methods • A number of water chemistry parameters were measured in the 2003-04 survey including: • pH, alkalinity, aluminum, calcium (Ca), chloride (Cl), colour, conductivity, dissolved inorganic carbon, dissolved organic carbon (DOC), iron, potassium, magnesium, manganese, sodium, ammonium (NH4), nitrate/nitrite (NO3), total Kjeldahl nitrogen (TKN), phosphorus (TP), silica, and sulphate (SO4)
Nutrients: Nitrogen & Phosphorus Results from a whole-lake experiment conducted at the Experimental Lakes Area, near Kenora, ON in 1973 Carbon & Nitrogen only Barrier Carbon, Nitrogen & PHOSPHORUS Phosphorus is a nutrient that is the limiting factor “controlling” algal growth in aquatic ecosystems
Long-term declines in phosphorus – Dorset A lakes Regional trend Relative trends Average decline in TP = 28%
Seasonal nitrate in Callander Bay 1988 2003 1989 2004 1990
Other interesting results • Is road salt affecting the lake? • Is dissolved organic carbon (DOC) changing? • Are calcium concentrations changing?
Summary • Acid rain: both pH and sulphate (SO4) concentration have decreased • Nutrients: • Total Kjeldahl nitrogen (TKN) has not changed, but nitrate/nitrite (NO3) and ammonium (NH4) have increased • Total phosphorus (TP) has increased, but this may be a lab artefact (levels are lower than the 1970s)
Summary • Other parameters: • Chloride (Cl) has increased • Dissolved Organic Carbon (DOC) has not changed • Calcium (Ca) has decreased
Thank You Are there any questions?
MOE – North Bay Office • District staff proactively inspect municipal STPs to ensure compliance with MOE issued Certificates of Approval. The district also inspects large sub-surface sewage systems that have a flow rate of >10,000 LPD (usually associated with resorts). • District staff conduct comprehensive inspections of hazardous waste generators, waste sites and industrial air dischargers, water users taking >50,000 LPD – all to ensure compliance with MOE issued approvals and permits.
MOE – North Bay Office • District Environmental Officers respond to spills and other environmental incidents to ensure proper clean-up and compliance with Ontario’s environmental legislation such as the Environmental Protection Act, Ontario Water Resources Act, Pesticides Act. • District staff also conduct initial sampling for suspected Blue Green Algae complaints and forward results to the local Health unit for follow up action (if positive)
MOE – North Bay Office • District staff conduct spring phosphorus sampling and in some cases dissolved oxygen surveys. • MOE also operates a 24 hour spill reporting center – 1-800-268-6060
Nitrogen Components TN = TKN + NO3 = TIN + TON TKN = TON + NH4 TON = TN – (NO3 + NH4) = TKN – NH4 TIN = NO3 + NH4
Observed Changes over Time * - significant difference at P<0.05