Fund-Raising Equation and Graphical Methods
130 likes | 248 Views
Explore solving equations numerically and graphically, discerning continuous graphs, and applying functions in fund-raising scenarios. Learn key terms and skills. Practice solving practical problems and understanding graph continuity.

Fund-Raising Equation and Graphical Methods
E N D
Presentation Transcript
Activity 1 - 9 Fund-Raiser Revisited
5-Minute Check on Activity 1-8 • In a wind chill chart, what is the independent variables? • In a wind chill chart, what is the dependent variable? • How do we test a graph to see if it is a function? • What is the domain and range of x +2 ? • What is the domain and range of ? Wind-speed and temperature Apparent temperature Vertical line test Domain: x > -2 Range: y > 0 1 ---------- x - 3 Domain: x ≠ 3 Range: y ≠ 0 (graph it! we will see just how this works later) Click the mouse button or press the Space Bar to display the answers.
Objectives • Solve an equation numerically • Solve an equation graphically • Distinguish between a situation represented by a graph of distinct points versus a continuous path
Vocabulary • Evaluated – plugging in a value for the variable • Equation – two numerical expressions separated by an = • Numerical method – guess a number, check and repeat • Graphical method – plot points and interpolate the graph • Solution – a replacement value for the variable that produces equal numerical values on both sides of the equation • Continuous – a graph is continuous if there are no gaps, or jumps in the graph • Discontinuity – a jump, gap or disconnect between two points on the graph
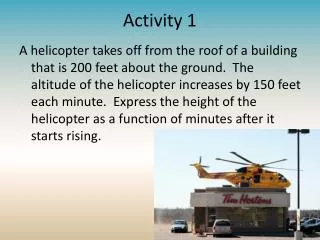
Activity In a previous activity we found the equation y = 2.5x modeled the fund raiser with x representing the number of tickets sold and y representing the amount of money donated to summer camp fund. • How much money is raised if 84 tickets are sold? • Fill in the table below
Activity - 1 In a previous activity we found the equation y = 2.5x modeled the fund raiser with x representing the number of tickets sold and y representing the amount of money donated to summer camp fund. • Use the table below to guess at how many tickets have to be sold to raise $200 • What’s the disadvantage to “guess & check”?
y Activity - 2 In a previous activity we found the equation y = 2.5x modeled the fund raiser with x representing the number of tickets sold and y representing the amount of money donated to summer camp fund. • Use the graph below to determine how many tickets have to be sold to raise $200 • What’s the disadvantage to a graphical method? x
y Problem - 1 The recommended weight of an adult male can be approximated by the formula, w = 5.5 h – 220, where w is recommended weight and h is height in inches. • What is the practical domain for the weight function? • Complete the following table • Graph your values in b). x
y Problem - 2 The recommended weight of an adult male can be approximated by the formula, w = 5.5 h – 220 , where w is recommended weight and h is height in inches. • Write an equation that can be used to determine the height of a man who weighs 165 pounds. • Solve the equation by guess and check • Solve the equation by graphing x
y y y x x x Continuous vs Not Continuous Which of the graphs below are continuous functions and which are not?
Graphical Continuity • A graph is continuous if we can graph the entire “curve” without lifting our pencil from the paper. • There are 3 types of discontinuities • point: where a point is missing in the curve • infinite: where the function is undefined (denominator equal to zero!) • jump: where we have to jump to the next point on the graph
1/x if x ≠ 0 f(x) = 0 if x = 0 x²/x if x ≠ 0 f(x) = 1 if x = 0 Continuity • Definition: A function is continuous at a number a if • Note: that the definition implicitly requires three things of the function • f(a) is defined (i.e., a is in the domain of f) • Note the graphs of the examples of discontinuities below: lim f(x) = f(a) xa lim f(x) exisits xa lim f(x) = f(a) xa Point Infinite Point Jump x² - x - 2 f(x) = -------------- x - 2 f(x) = [[x]]
Summary and Homework • Summary • To solve an equation using a: • numerical approach: use a guess, check and repeat process • graphical approach: read the appropriate x,y coordinates on the graph of the equation • algebra: solve for the variable in question • Graphs are continuous if you can trace the graph without having to lift your pencil from the paper (no breaks!) • Homework • pg 83-86; 1-4