Download
1 / 46
460 likes | 682 Views
Week 8 Dynamics of Particulate systems. (1) Electrohydrodynamic atomization fabrication of pharmaceutical particles , (2) bubble motion in Taylor vortex, (3) vibrated granular bed system, (4) pneumatic transport of granular material.

E N D
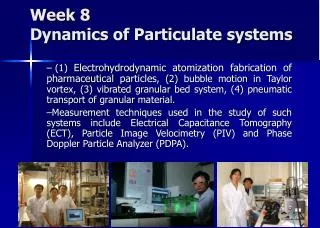
Week 8 Dynamics of Particulate systems • (1) Electrohydrodynamic atomization fabrication of pharmaceutical particles, (2) bubble motion in Taylor vortex, (3) vibrated granular bed system, (4) pneumatic transport of granular material. • Measurement techniques used in the study of such systems include Electrical Capacitance Tomography (ECT), Particle Image Velocimetry (PIV) and Phase Doppler Particle Analyzer (PDPA).
Computer Inner cylinder Outer cylinder Bubble Motion in Taylor Vortex Laser Generator Camera Synchronizer Mineral Oil: (25C) ρ=0.86g/cm3 η=29.67cp
Bubble Motion in Taylor Vortex Radius ratio (η=ri/ro) : 0.613 Aspect ratio (Γ=L/d): 5.17 Clearance ratio (c=d/ri): 0.63 Air bubble: (25C) ρ=0.0012g/cm3 η=0.0185cp Reynolds number: 65 ~ 520 Taylor number: 1.1e4 ~ 6.8e5
Core bubble: ring structure Ω =300rpm, Side View 110 Bubbles 68 Bubbles R.S. Deng, C.H. Wang, and K. A. Smith, “Bubble behavior in a Taylor vortex”, Physical Review E, 73, 036306 (2006).
Ri Ro Ri Ro Ri Ro Ri Ro Ri Ro Ri Ro Ri Ro Ri Ro Ri Ro Ri Ro Ri Ro Ri Ro 20.0 rpm 90.1 rpm 107.8 rpm 155.3 rpm 179.9 rpm 200.1 rpm 300.0 rpm 352.4 rpm 387.6 rpm 500.0 rpm 600.0 rpm 800.4 rpm Flow pattern in pure liquid system Ω One-dimensional flow turns into Taylor vortex flow at about 95rpm, and no wavy vortex is observed below 800rpm in the present system.
Ri Ro Core Bubble Two types of bubbles R.S. Deng, C.H. Wang, and K. A. Smith, “Bubble behavior in a Taylor vortex”, P hysical Review E, 73, 036306 (2006). P3 P1 P4 P2 Pressure distribution calculated from CFD (Fluent 6.1) Wall Bubble
Application of Particle Image Velocimetry (PIV) for Pattern Characterization in a Vertically Vibrated Granular Layer Discrete Element Simulation High-speed video camera, 1,000fps
Experimental apparatus (1) Synchronizer (2) Computer (3) Laser generator (4) CCD camera (5) Vessel (6) Vibrator (7) Function generator (8) Power amplifier
Image captured by PIV camera Peak Peak Free Space Valley Granular Layer Detachment Bottom Plate
Typical stages in a vibrating cycle (First Half) (First Half) Impact Contact R.S. Deng and C.H. Wang, "Particle Image Velocimetry Study on the Pattern Formation in a Vertically Vibrated Granular Bed", Phys. Fluids, 15(12) 3718-3729 (2003). (Second Half) Free-flight
Flow Stability Analysis H Granular Layer Taking average over one period Mt A, f Vibrator H Granular Layer Mt Example Qt VY=0
Governing Equations • Continuity • Momentum • Energy
Stability Analysis Perturbation Form Perturbations: Where: And
Stability Analysis Stability Diagram R.S. Deng and C.H. Wang, "Instabilities of Granular Materials under Vertical Vibrations", J. Fluid Mechanics, 492, 381-410 (2003).
Surface Patterns (I) Stripe R.S. Deng and C.H. Wang, "Instabilities of Granular Materials under Vertical Vibrations", J. Fluid Mechanics, 492, 381-410 (2003). 1-Perturbation Simulation (This work) Experiment (Umbanhowar, Nature, 389, 1997)
Surface Patterns (II) Square R.S. Deng and C.H. Wang, "Instabilities of Granular Materials under Vertical Vibrations", J. Fluid Mechanics, 492, 381-410 (2003). 2-Perturbations Simulation (This work) Experiment (Umbanhowar, Nature, 389, 1997)
Chem. Eng. Sci., 53(22), 3803-3819 (1998) J. Fluid Mech., 435, 217-246 (2001). J. Fluid Mech., 435, 217-246 (2001).
Signal Delay ( D ) Cross Correlation U = L /D L Plane 1 Plane 2 V Twin plane ECT system(Velocity measurement)
S.M. Rao, K. Zhu, C.H. Wang, and S. Sundaresan, “Electrical Capacitance Tomography Measurements on the Pneumatic Conveying of Solids”, Ind. Eng. Chem. Res. 40(20) 4216-4226 (2001). (a) (a) (b) (b) t t X X Y Y Homogeneous flow (a) typical flow pattern (b) time averaged particle concentration profile (c) particle concentration contours. Moving Dunes (a) typical flow pattern (b) time averaged particle concentration profile (c) particle concentration contours.
(a) (a) (b) (b) t t X X Y Y Flow over settled layer (a) typical flow pattern (b) time averaged particle concentration profile (c) particle concentration contours. Plug Flow (a) typical flow pattern (b) time averaged particle concentration profile (c) particle concentration contours. S.M. Rao, K. Zhu, C.H. Wang, and S. Sundaresan, “Electrical Capacitance Tomography Measurements on the Pneumatic Conveying of Solids”, Ind. Eng. Chem. Res. 40(20) 4216-4226 (2001).
S.M. Rao, K. Zhu, C.H. Wang, and S. Sundaresan, “Electrical Capacitance Tomography Measurements on the Pneumatic Conveying of Solids”, Ind. Eng. Chem. Res. 40(20) 4216-4226 (2001). Homogeneous Moving dunes 0.08 0.015 0.06 s s 0.01 0.04 0.005 0.02 0 0 0 0 1 2 3 4 5 1 2 3 4 5 -6 -5 Sec Sec x 10 x 10 6 8 6 S 4 S 4 2 2 0 4 0 2 6 8 10 0 0 2 4 6 8 10 Hz Hz Eroding dunes Plug flow 1 0.2 0.8 0.15 s s 0.6 0.1 0.4 0.05 0.2 0 0 0 1 2 3 4 5 -4 10 15 20 25 Sec x 10 Sec x 10 -2 4 2 3 S 2 1 1 S 0 0 1 2 3 4 5 Hz 0 0 1 2 3 4 5 Hz Polypropylene particles ( - average solid concentration, S – power spectrum density) Power spectra of solid concentration fluctuations from single plane data can characterize various flow regimes of pneumatic conveying.
(a) (b) N N (c) (d) W E W E S S Distribution of polypropylene particles in a vertical riser flow –dispersed flow Ug = 15.6 m/s Gs = 31.4 kg/(m2.s). K. Zhu, S.M. Rao , C.H. Wang, and S. Sundaresan “Electrical Capacitance Tomography Measurements on the Vertical and Inclined Pneumatic Conveying of Granular Solids“, Chem. Eng. Sci. 58(18) 4225-4245 (2003). Left: z = 0.47 m Right: z = 2.05 m
0.1 0 (b) t Distribution of polypropylene particles in a vertical riser flow – slugging flow (a) Slugging flow Ug = 14.3 m/s Gs = 21.7 kg/(m2.s) Z = 2.05 m K. Zhu, S.M. Rao , C.H. Wang, and S. Sundaresan “Electrical Capacitance Tomography Measurements on the Vertical and Inclined Pneumatic Conveying of Granular Solids“, Chem. Eng. Sci. 58(18) 4225-4245 (2003). (c)
(a) (b) t (d) N W E (c ) S Distribution of polypropylene particles in a vertical riser flow – annular capsule flow Slugging flow Ug = 13.0 m/s Gs = 7.0 kg/(m2.s) Z = 2.05 m K. Zhu, S.M. Rao , C.H. Wang, and S. Sundaresan “Electrical Capacitance Tomography Measurements on the Vertical and Inclined Pneumatic Conveying of Granular Solids“, Chem. Eng. Sci. 58(18) 4225-4245 (2003).
Summary for Horizontal & Vertical Conveying • Using single plane data - time averaged particle concentration. • Using twin plane cross correlation – pattern velocity. • Single plane particle concentration data vs time data • (a) Homogeneous is not homogeneous. • (b) Moving dunes and eroding dunes with multiple characteristic peaks in the lower frequency region. • (c ) Plug flow with a single largest peak at near zero frequency. • Cross sectional variation of time averaged density distribution in different flow regimes.
Electrostatic Characterization J. Yao, Y. Zhang, C.H. Wang, S. Matsusaka, H. Masuda, “Electrostatics of the Granular Flow in a Pneumatic Conveying System“, Ind. Eng. Chem. Res., 43, 7181-7199 (2004).
Disperse flow –pattern observed in thevertical pipe Initial condition The clusters were located fairly high up in the pipe and traveled along a curved path by the pipe wall. These clusters appeared and disappeared intermittently in an unpredictable manner. J. Yao, Y. Zhang, C.H. Wang, S. Matsusaka, H. Masuda, “Electrostatics of the Granular Flow in a Pneumatic Conveying System“, Ind. Eng. Chem. Res., 43, 7181-7199 (2004). Two hours later
Ring flow -vertical granular pattern Initial condition Particles were observed to travel in a spiral fashion up the vertical pipe along the pipe wall. This resulted in a ring or annulus structure with high particle concentrations adjacent to the wall and a relatively empty core region J. Yao, Y. Zhang, C.H. Wang, S. Matsusaka, H. Masuda, “Electrostatics of the Granular Flow in a Pneumatic Conveying System“, Ind. Eng. Chem. Res., 43, 7181-7199 (2004). Fifteen minutes later
Polymer film Pipe wall Sections A & C Test station B electrometer Aluminum foil Induced current measurement K. Zhu, S.M. Rao , Q.H. Huang, C.H. Wang, S Matsusaka, and H. Masuda, “On the Electrostatics of Pneumatic Conveying of Granular Materials Using Electrical Capacitance Tomography“, Chem. Eng. Sci., 59(15) 3201-3213(2004).
(a) (b) (a) MPCT measurement (b) ECT Measurement U = 14.3 m/s, Gs = 0.08 kg/sMoving capsule flow K. Zhu, S.M. Rao , Q.H. Huang, C.H. Wang, S Matsusaka, and H. Masuda, “On the Electrostatics of Pneumatic Conveying of Granular Materials Using Electrical Capacitance Tomography“, Chem. Eng. Sci., 59(15) 3201-3213(2004).
Induced current –vertical pipe • Comparison of the current value (negative) for the three flows. • Comparison of the charge accumulation for the three flows. J. Yao, Y. Zhang, C.H. Wang, S. Matsusaka, H. Masuda, “Electrostatics of the Granular Flow in a Pneumatic Conveying System“, Ind. Eng. Chem. Res., 43, 7181-7199 (2004).
Summary: Electrostatics in Pneumatic Conveying • Air flow rate is a key factor determining the electrostatic behavior of granular flow. The lower the air flow rate, the higher the induced current and particle charge density. These in turn lead to particle clustering and the formation of such structures as half-ring and ring in the vertical conveying pipe. • Electrostatic effects increase with time. The charge accumulated at the pipe wall increases with time and the rate of increase seems constant for each of the three types of flow. Particle charge density also increases with time and this may account for clustering behavior occurring at the vertical pipe wall even when a high air flow rate is used and the dominant flow regime is that of disperse flow. Pipe wall material has an obvious effect on the electrostatics of the granular flow. • Electrostatic effects depend on composition for particle mixture. The commercially available anti-static agent, Larostat-519 powder, was found to reduce electrostatic effects within the system effectively. • The mechanism of electrostatic charge generation for the granular flow in the pneumatic conveying system mainly depends on tribroelectrification due to strong force effect on the surface when the particles slide on the pipe wall.
DEM Simulation • Newton’s Laws of Motion • Force-displacement Model g Reversed flow in pneumatic conveying in an inclined pipe
DEM Simulation • Fluid Drag Force Model Fluidized bed simulation using DEM Di Felice, R. The voidage function for fluid-particle interaction systems. Int. J. Multiph. Flow1994, 20, 153.
DEM Simulation • Computational Fluid Dynamics Pneumatic Conveying simulations using DEM
Simulation Conditions Material Properties and System Parameters Rao, S. M.; Zhu, K.; Wang, C. H.; Sundaresan, S. Electrical capacitance tomography measurements on the pneumatic conveying of solids. Ind. Eng. Chem. Res.2001, 40, 4216.
Simulation Conditions • Particles first allowed to settle under gravity for 0.5 s before gas flow was initiated • Periodic boundary conditions applied to the solid phase to simulate an open flow system • Solid concentration, , defined as overall volume fraction of particles divided by volume fraction of particles at maximum packing (0.64)
Results and Discussion Plug Flow = 0.32 Gas velocity 14 m s-1 Dispersed Flow = 0.08 Gas velocity 14 m s-1 W.C. Lim, C.H. Wang, and A.B. Yu, “Discrete Element Simulation for Pneumatic Conveying of Granular Material” AIChE Journal, 52, 496-509 (2006).
Results and Discussion Stratified Flow = 0.08, Gas velocity 10 m s-1 Moving dunes = 0.16, Gas velocity 10 m s-1 Slug Flow = 0.32, Gas velocity 10 m s-1 Homogeneous Flow = 0.16, Gas velocity 30 m s-1 W.C. Lim, C.H. Wang, and A.B. Yu, “Discrete Element Simulation for Pneumatic Conveying of Granular Material” AIChE Journal, 52, 496-509 (2006).
The different flow regimes in vertical pneumatic conveying are represented in the form of phase diagrams Dashed lines separate regions representing different flow regimes while dashed circles enclose regions where transition between two adjacent flow regimes might be taking place In vertical pneumatic conveying, the dispersed flow regime is dominant at high gas velocities and low solid concentrations while the plug flow regime is dominant otherwise Results and Discussion W.C. Lim, C.H. Wang, and A.B. Yu, “Discrete Element Simulation for Pneumatic Conveying of Granular Material” AIChE Journal, 52, 496-509 (2006).
Similarly, the homogeneous flow regime is dominant at high gas velocities and low solid concentrations while the slug flow regime is dominant otherwise in horizontal conveying At low gas velocities and solid concentrations, effects of gravitational settling result in the formation of the moving dunes and stratified flow regimes Intermediate values of gas velocities involve transitions between moving dunes and homogeneous flow and between stratified and homogeneous flow Results and Discussion W.C. Lim, C.H. Wang, and A.B. Yu, “Discrete Element Simulation for Pneumatic Conveying of Granular Material” AIChE Journal, 52, 496-509 (2006).
The solid concentration profile for dispersed flow in vertical pneumatic conveying shows that solid concentrations are higher near the walls than in the center of the pipe This trend is similar for all gas velocities simulated Results and Discussion W.C. Lim, C.H. Wang, and A.B. Yu, “Discrete Element Simulation for Pneumatic Conveying of Granular Material” AIChE Journal, 52, 496-509 (2006).
The solid concentration profiles in horizontal pneumatic conveying show quantitatively the effects of gravitational settling which results in higher solid concentrations along the bottom wall of the pipe As before, the solid concentration profiles are quantitatively similar for different gas velocities used Results and Discussion W.C. Lim, C.H. Wang, and A.B. Yu, “Discrete Element Simulation for Pneumatic Conveying of Granular Material” AIChE Journal, 52, 496-509 (2006).