Download
1 / 1
10 likes | 116 Views
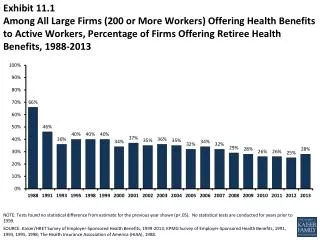
This exhibit shows the percentage of large firms offering health benefits to active and retired workers from 1988 to 2013. The data is sourced from various surveys and reveals trends in employer-sponsored health benefits over the years.

E N D
Exhibit 11.1Among All Large Firms (200 or More Workers) Offering Health Benefits to Active Workers, Percentage of Firms Offering Retiree Health Benefits, 1988-2013 NOTE: Tests found no statistical difference from estimate for the previous year shown (p<.05). No statistical tests are conducted for years prior to 1999. SOURCE: Kaiser/HRET Survey of Employer-Sponsored Health Benefits, 1999-2013; KPMG Survey of Employer-Sponsored Health Benefits, 1991, 1993, 1995, 1998; The Health Insurance Association of America (HIAA), 1988.