Download

1 / 41
410 likes | 426 Views
Explore techniques in ratio games, base system selection, relative performance enhancement, and correct analysis of ratios in computer systems performance analysis. Learn to design experiments effectively, avoid common mistakes, and understand different types of experimental designs.

E N D
Ratio GamesandDesigning Experiments Andy Wang CIS 5930-03 Computer Systems Performance Analysis
Ratio Games • Choosing a base system • Using ratio metrics • Relative performance enhancement • Ratio games with percentages • Strategies for winning a ratio game • Correct analysis of ratios
Choosing a Base System • Run workloads on two systems • Normalize performance to chosen system • Take average of ratios • Presto: you control what’s best
Example of Choosinga Base System • (Carefully) selected Ficus results:
Why Does This Work? • Expand the arithmetic:
Using Ratio Metrics • Pick a metric that is itself a ratio • E.g., power = throughput response time • Or cost/performance • Handy because division is “hidden”
Relative Performance Enhancement • Compare systems with incomparable bases • Turn into ratios • Example: compare Ficus 1 vs. 2 replicas with UFS vs. NFS (1 run on chosen day): • “Proves” adding Ficus replica costs less than going from UFS to NFS
Ratio Games with Percentages • Percentages are inherently ratios • But disguised • So great for ratio games • Example: Passing tests • A is worse, but looks better in total line!
More on Percentages • Psychological impact • 1000% sounds bigger than 10-fold (or 11-fold) • Great when both original and final performance are lousy • E.g., salary went from $40 to $80 per week • Small sample sizes generate big lies • Base should be initial, not final value • E.g., price can’t drop 400%
Strategies for Winninga Ratio Game • Can you win? • How to win
Can You Winthe Ratio Game? • If one system is better by all measures, a ratio game won’t work • But recall percent-passes example • And selecting the base lets you change the magnitude of the difference • If each system wins on some measures, ratio games might be possible (but no promises) • May have to try all bases
How to WinYour Ratio Game • For LB metrics, use your system as the base • For HB metrics, use the other as a base • If possible, adjust lengths of benchmarks • Elongate when your system performs best • Short when your system is worst • This gives greater weight to your strengths
Correct Analysis of Ratios • Previously covered in Lecture 2 • Generally, harmonic or geometric means are appropriate • Or use only the raw data
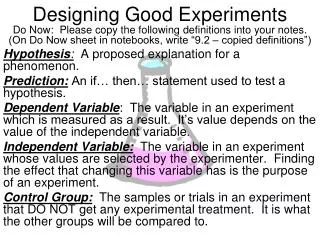
Introduction To Experimental Design • You know your metrics • You know your factors • You know your levels • You’ve got your instrumentation and test loads • Now what?
Goals in Experiment Design • Get maximum info with minimum work • Typically meaning minimum number of experiments • More experiments aren’t better if you’re the one who has to perform them • Well-designed experiments are also easier to analyze
Experimental Replications • System under study will be run with varying levels of different factors, potentially with differing workloads • Run with particular set of levels and other inputs is a replication • Often, need to do multiple replications with each set of levels and other inputs • Usually necessary for statistical validation
Interacting Factors • Some factors have completely independent effects • Double the factor’s level, halve the response, regardless of other factors • But effects of some factors depends on values of others • Called interacting factors • Presence of interacting factors complicates experimental design
The Basic Problemin Designing Experiments • You’ve chosen some number of factors • May or may not interact • How to design experiment that captures full range of levels? • Want minimum amount of work • Which combination or combinations of levels (of factors) do you measure?
Common Mistakesin Experimentation • Ignoring experimental error • Uncontrolled parameters • E.g., CPU voltage scaling • Not isolating effects of different factors • One-factor-at-a-time experimental designs • Interactions ignored • Designs require too many experiments
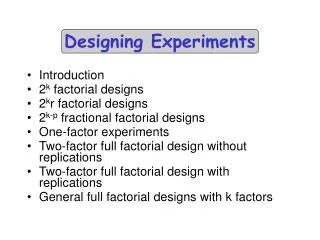
Types ofExperimental Designs • Simple designs • Full factorial design • Fractional factorial design
Simple Designs • Vary one factor at a time • For k factors with ith factor having ni levels, no. of experiments needed is: • Assumes factors don’t interact • Even then, more effort than required • Don’t use it, usually
Full Factorial Designs • Test every possible combination of factors’ levels • For k factors with ith factor having ni levels: • Captures full information about interaction • But a huge amount of work
Reducing the Work inFull Factorial Designs • Reduce number of levels per factor • Generally good choice • Especially if you know which factors are most important • Use more levels for those • Reduce number of factors • But don’t drop important ones! • Use fractional factorial designs
Fractional Factorial Designs • Only measure some combination of levels of the factors • Must design carefully to best capture any possible interactions • Less work, but more chance of inaccuracy • Especially useful if some factors are known to not interact
2k Factorial Designs • Used to determine effect of k factors • Each with two alternatives or levels • Often used as preliminary to larger performance study • Each factor measured at its maximum and minimum level • Sometimes normal vs. 2x normal, 25% vs. 75% quartiles • Might offer insight on importance and interaction of various factors
Unidirectional Effects • Effects that only increase as level of a factor increases • Or vice versa • If system known to have unidirectional effects, 2k factorial design at minimum and maximum levels is useful • Shows whether factor has significant effect
22 Factorial Designs • Two factors with two levels each • Simplest kind of factorial experiment design • Concepts developed here generalize • Regression can easily be used
22 Factorial Design Example • Consider parallel operating system • Goal is fastest possible completion of a given program • Quality usually expressed as speedup • We’ll use runtime as metric (simpler but equivalent)
Factors and Levelsfor Parallel OS • First factor: number of CPUs • Vary between 8 and 64 • Second factor: use of dynamic load management • Migrates work between nodes as load changes • Other factors possible, but ignore them for now
Defining Variables for22 Factorial OS Example if 8 nodes if 64 nodes if no dynamic load mgmt if dynamic load mgmt
Sample Datafor Parallel OS • Single runs of one benchmark 8 Nodes 64 Nodes NO DLM 820 217 DLM 776 197
Regression Modelfor Example • y = q0 + qAxA + qBxB + qABxAxB • Note that model is nonlinear! 820 = q0 – qA – qB + qAB 217 = q0 + qA – qB – qAB 776 = q0 – qA + qB – qAB 197 = q0 + qA + qB + qAB
Solving the Equations • 4 equations in 4 unknowns • q0 = 502.5 • qA = -295.5 • qB = -16 • qAB = 6 • So y = 502.5 –295.5xA– 16xB + 6xAxB
The Sign Table Method • Write problem in tabular form I A B AB y 1 -1 -1 1 820 1 1 -1 -1 217 1 -1 1 -1 776 1 1 1 1 197 2010 -1182 -64 24 Total 502.5 -295.5 -16 6 Total/4
Allocation of Variationfor 22 Model • Calculate the sample variance of y: • Numerator is SST: total variation SST = 22qA2 + 22qB2 + 22qAB2 • SST explains causes of variation in y
Terms in the SST • 22qA2 is variation explained by effect of A: SSA • 22qB2 is variation explained by effect of B: SSB • 22qAB2 is variation explained by interaction between A and B: SSAB SST = SSA + SSB + SSAB
Variations in Our Example • SST = 350449 • SSA = 349281 • SSB = 1024 • SSAB = 144 • Now easy to calculate fraction of total variation caused by each effect
Fractions of Variation in Our Example • Fraction explained by A is 99.67% • Fraction explained by B is 0.29% • Fraction explained by interaction of A and B is 0.04% • So almost all variation comes from number of nodes • If you want to run faster, apply more nodes, don’t turn on dynamic load management
General 2kFactorial Designs • Used to explain effects of k factors, each with two alternatives or levels • 22 factorial designs are a special case • Same methods extend to more general case • Many more interactions between pairs (and trios, etc.) of factors
Sample 23 Experiment • Sign table A, B, C are binary count; interactions are products of columns: