Download
1 / 15
150 likes | 254 Views
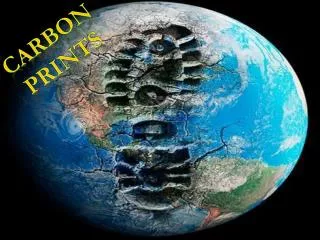
Measuring Institutional Carbon Food prints. Leana Houser Johns Hopkins University. Why food?. PEW Center on Global Climate Change 2006: 1/3 anthropogenic warming associated with greenhouse gases is from worldwide agriculture and land use change. Why food?. IPCC 2007:

E N D
Measuring InstitutionalCarbon Foodprints • Leana Houser • Johns Hopkins University
Why food? • PEW Center on Global Climate Change 2006: • 1/3 anthropogenic warming associated with greenhouse gases is from worldwide agriculture and land use change
Why food? • IPCC 2007: • “global increases in carbon dioxide (CO2) concentration are due primarily to fossil fuel use and land usechange, while those of methane (CH4) and nitrous oxide (N2O) are primarily due to agriculture.”
Why food? • UNFAO “Livestock’s Long Shadow” 2006: • 18% world anthropogenic greenhouse gas emissions • Methane and Nitrous Oxide Beef and Dairy = 46%
What is the food system? • Agriculture • Processing, packaging • Transport and delivery • Preparation • Waste CO2, CH4 and N2O CO2 CO2 CO2 CH4
What should we measure? • Agriculture • Processing, packaging • Transport and delivery • Preparation • Waste Farm to Door Already captured in existing tools
What did we do? CA-CP and CLF Collaboration Literature Review www.jhsph.edu/clf
Results Tools for quantifying institutional GHG emissions
A New Tool • Recommendations for CA-CP’s Foodprint tool: • Include a “Food Pantry” • Allow for user generated entries • Impacts reported in GHG and other environmental impacts
Institutional Changes • Develop lower GHG food purchasing policies • Purchase seasonal and regional produce • Eliminate air freighted items • Menu development • Substitute beef and dairy with lower foodprint items • Reduce serving sizes of beef and dairy • Be creative with vegetarian recipes & offer more • Audit kitchens • Energy efficient appliances • Efficient cooking procedures
Individual Behavior Change Source:Bon Appétit Management Company. (2008). Low Carbon Diet Calculator http://www.eatlowcarbon.org/
Questions? Contact me! Leana Houser Johns Hopkins University 410-516-4002 lhouser@jhu.edu