Download

1 / 83
830 likes | 963 Views
BU247 Managerial Accounting. with Natasha Neumann- Causi and Mike Pegutter. Updated Presentation. This presentation is up to date Uses material from new textbook Follows course outline Contains examples from prior exams and from textbook questions

E N D
BU247 Managerial Accounting with Natasha Neumann-Causi and Mike Pegutter
Updated Presentation This presentation is up to date • Uses material from new textbook • Follows course outline • Contains examples from prior exams and from textbook questions • If I miss something, let me know and I will explain it now or in an email
General Study Tips • DON’T PANIC! • USE YOUR HANDOUT! • Know the theory well, do not memorize calculations! • Practice homework with time constraints • If you get stuck on a question, leave it and come back later • When in doubt, GUESS! Never leave a question blank • Make sure you have answered everythingthe question asked for!!!
Exam Outline • Multiple Choice Questions • Definitions • Smaller calculations • Theories • Journal Entries • True / False or Fill in the Blank • Theories and Definitions • Short Answers • Big Calculations • Writing out Steps to Calculations
Agenda PART I: Introduction and CVP Analysis • What is management accounting? • Cost behaviour • Cost-Volume-Profit Analysis PART II: Cost Behaviour • Variations in cost behaviours • Income Statement approaches PART III: Cost Allocation • Overhead Rate Calculation • Applying Overhead PART IV: System Design and Allocation • Job Order vs. Process • Service Departments PART V: ABC Costing
Managerial Accounting • For management purposes only • Cost allocations and calculations • Budgeting and future planning • Production decisions • Product decisions • Always keep in mind: • Benefit versus cost tradeoff • Will the systems aid management?
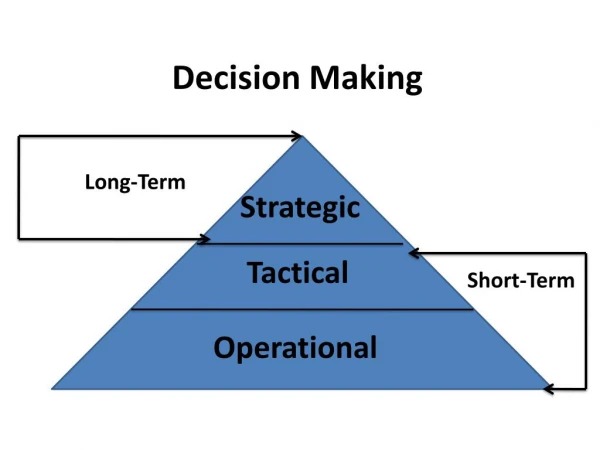
Framework of Cost Accounting • Strategic Planning – focus on company objectives • Factory location • Mergers & acquisitions • Management Control – focus on resource efficiency • Budget analysis • Variance analysis • Operational Control – task efficiency • Inventory control • Cash management
Central Layout Management accounting involves: • planning (alternative identification and budgeting) • controlling (actions and evaluations of those actions) • directing and motivating (smooth operations, conflict resolution, etc.)
Decisions & Information Decision Process Accounting Information Types Problem Solving Information– used for long-range planning Attention Directing Information– used for controlling routine operations Scorekeeping Information– used by investors, tax collectors, etc. • Identify the problem • Understand the Key Success Factors of the company • Identify alternative solutions • Quantitative and qualitative analyses • Evaluation solutions and chose one • Implementation of the plan
Key Success Factors • Critical for an organization’s success • Example: excellent customer service for fast food companies • Differ depending on the industry and the company • Managed carefully to maintain or improve the success of a business • Considered in decision-making processes and always at the forefront
Professional Ethics • Competence: be able to recognize limitations, follow laws, provide accurate and timely information • Confidentiality: do not use confidential information and do not give that information • Integrity: be open about conflicts of interest, avoid actions that would jeopardize reputation • Credibility: communicate, disclose problems and all relevant information that others need to know
Professional Ethics • Resolution Conflict: follow official policies, or talk to supervisors • confidentially should be maintained, consult legal professionals • Corporate Governance: is the set of processes, customs, policies and laws which affect the way a company is directed, administrated or controlled • should provide incentives for the pursuit of goals which benefit the stakeholders
Process Management Approaches to improving processes: • Lean Production – minimize inventory and “pull” units through processes in response to customer orders • Six Sigma – reduce defective products to near zero by using feedback and numerical data • Define, Measure, Analyze, Improve, Control • Computer Technology – refers to the growing popularity of E-commerce and enterprise systems • Enterprise systems– software program that combines all data • Risk Management – proactively seeking out potential sources of risk, preparing yourself, or prevent it
Cost Behaviour • A cost driveris source of your total costs • Example: the number of man hours clocked in a laboratory will make your total cost of R&D rise • Variable costsare costs that change in direction relation to changes in cost drivers (per unit) • Example: lab technicians are paid more depending on how many hours they work • Fixed costsare not immediately affected by changes in the driver (total amounts) • Examples: rent, insurance payments, taxes
Relevant Range • Relevant rangeand Step Variable Costs are ranges where your per unit variable costs and your fixed costs will stay constant • Outside of this range these costs will change • As long as Brick Brewery is making between 30,000 and 75,000 cases of beer, it costs $3.00 a beer to produce and fixed costs are $1.5M a month. 30 75
Cost – Volume – Profit Analysis Total Sales Total Costs Breakeven Point Fixed Costs
Breakeven Analysis • Calculating how many units need to be sold before you can start making some profits • Equation Approach: • Contribution Margin Method:
CVP Analysis Example A Playstation3 console is priced at $300 but costs about $250 each to make. Sony’s fixed costs for its gaming departments total about $17M a month and they manage to sell about 1M consoles a month. Calculate Sony’s breakeven point in dollars • Step 1: Which formulas? • We need to end up with a breakeven, • point in dollars, which means we need to • To calculate contribution margin as a %. • Step 2: Contribution Margin % • CM = $300 - $250 = $50/unit • CM% = $50/$300 = 0.16667 Step 3: BEP in Dollars $17M x 12 months = $204M/year fixed costs $204M/0.16667 = $1,123.976M a Step 4: Concluding Sentence Sony will have to sell $1,123,976,000 worth of PS3 in order to breakeven
Changes in Volume and Sales • It helps to create simple income statements to help show what the contribution margin is and how it changes when multiple components are changing • Also consider using this formula:
CM Changes Example Assume basketballs can be made at a variable cost of $5/unit and with fixed costs totalling $50,000 per month. Each basketball is sold for $15/each and current sales total 5,000 units per month. Consider the following: A) What is the profit impact if variable costs decrease by $2/unit, advertising costs are increased by $25,000 per month and therefore sales increase by 1,500 units? B) What price should be charged in order to achieve $75,000 in monthly profits (keeping everything else the same)? Condition B Required: $75,000 in Net Income $75,000 = (Price - $5)(5,000 units) – $50,000 $125,000 = Price(5,000 units) - $25,000 $150,000 = Price(5,000) Price = $30
Margin of Safety • The excess of budgeted (or actual) sales over the break-even volume of sales Sports Illustrated sells 3.5 million magazines a month at an average price of $5. The cost to produce one magazine is approximately $0.50. Fixed expenses per month are $15M. What is their margin of safety? Step 1: Breakeven Unit Sales Breakeven Point in Units = (Fixed Costs)/(CM per unit) Breakeven Point in Units = $15M/(5-0.5) = 3,333,333.33 Round up to 3,333,334 units Step 2: Margin of Safety Margin of Safety = Total Sales – Breakeven Sales MOS = 3.5M – 3.33M Margin of Safety is 166,667 units
CVP with Product Mixes • Companies which sell more than one product involves a ratio called a ‘sales mix’ • Management will try playing around with ratios like these to see which combination is more profitable • In situations with sales mixes the calculations for CM will change to ‘average contribution per unit’:
Multiproduct Example Bob’s tree farm sells two types of trees: pine and maple. The sales mix is 3:1 respectively. Each pine tree sells for $20 and each maple sells for $30. Bob estimates that each pine tree costs about $12 to grow and maintain until it is sold and about $15 for maples since they need more water. Bob’s fixed costs are $27,000 per year. Calculate Bob’s breakeven point in units. Step 1: Contribution Margin for Each Product Maple = $30-$15 = $15 Pine = $20 - $12 = $8 Step 2: Average Contribution Margin per Unit =(CM of pines x Sales mix %) + (CM of maples x Sales mix %) = ($8 x 75%) + ($15 x 25%) = $9.75 Step 3: Breakeven Point in Units BEP = Fixed Costs / Average CM per Unit BEP = $27,000 / $9.75 BEP = 2,769.23 Bob needs to sell 2,770 trees to breakeven
Cost Structure and Operating Leverage • Cost structure is relative proportion of fixed costs and variable costs • Operating leverage shows the proportion of your fixed costs The higher the operating leverage, the higher a company’s fixed costs are compared to variable costs so small changes in the volume of sales will result in large changes in income (and opposite)
Cost Structure and Operating Leverage Sales Sales $ $ Total Expenses Total Expenses Volume Volume High Operating Leverage High Fixed / Low Variable Costs Higher CM/Unit Higher Break-even Point Greater Risk Greater Potential Returns Low Operating Leverage Low Fixed / High Variable Costs Lower CM/Unit Lower Break-even Point Reduced Risk Lower Potential Returns
Cost Behaviours • Step costschange abruptly at intervals of activity because the resources and their costs come in indivisible chunks (example: salaries) • Mixed costscontain both variable and fixed cost elements • Example: maintenance costs – supplies + labour Management Influenced Costs • Capacity costs- fixed costs incurred when achieving a desired production level (example: building a plant) • Committed fixed costs-large indivisible chunks of cost that the company is obligated to pay • Example: mortgage payments • Discretionary fixed costsare heavily influenced by management’s decisions each period on how much to spend on things like advertising, research and development, training, etc. • Example: no more lavish award ceremonies every quarter for top salesmen • These costs do not have clear connections to production output levels Every cost could essentially be committed / discretionary but it depends on contracts you have and your ability to change it
Measuring Cost Behaviour • The mixed cost function is an equation of the cost and its driver; a linear equation looks like this Salesmen are paid guaranteed salaries of $50,000 per year plus 2% commission on sales. The dollar value of sales each salesman brings in is the cost driver. Calculate the total cost of wages given the following situations: Situation A Total Cost = $50,000 + ($400,000)2% = $58,000 • Situation B Total Cost = $50,000 + ($600,000)2% = $62,000
Measuring Cost Behaviour Activity Analysis Methods • Engineering Analysis– review of costs from past experiences • Account Analysis– review of accounting records and the subjective evaluation of patterns • High-Low Analysis– simple linear algebra method (unreliable results) • Scattergraph Analysis– line of fit method on a graph; where the intercept is the total fixed costs and every point on the line is an estimated total level of activity (X) and total costs (Y) - this method heavily uses the mixed cost function • Regression Analysis– a process of finding the equation that best fits the data Activity analysesare used to identify appropriate cost drivers for each individual activity and their effects on the costs of making a product
High-Low Analysis Example Given the following information, determine the cost equation for custodial services Step 1: High and Low Levels of Activity High 500 hours at $6,345 Low 250 hours at $4,375 Step 2: Change in Activity and Variable Cost Change in Cost = $6,345 - $4,375 = $1,970 Change in Hours = 500 – 350 = 250 hours Variable cost = $1,970/250 hours = $7.88 Step 3: Fixed Cost Estimate (Using July Numbers) Total Fixed Cost = Total Cost – Total Variable Cost Total Fixed Cost = $5,570 – (360 x $7.88) = $2,733.20 Step 4: Cost Equation Y = $2,733.20 + $7.88X
Regression Analysis • All the points are considered whereas the scattergraph considers only the points on the line of best fit • The goal is to minimize the sum of the square errors • This is the most accurate method Regression Analysis Output - The word “Constant” which appears on an output is the fixed cost - “R-squared” is an indicator of the accuracy of the results, the closer this number is to 1, the more X (independent) explains changes in Y (dependent) - “X-Coefficient” is the variable cost which is multiplied by the cost driver Excel Commands - LINEST() gives the slope of the line of best fit - INTERCEPT () gives the intercept of the line (fixed cost) - RSQ() gives the ‘r-squared’ value
Cost Behaviour: Product and Period Costs • Product Costs– all costs involved in the purchase or manufacture of products which are expensed when the product is sold • For a manufacturer these would include direct labour, direct materials, etc. • Inventory for a manufacturer (DM, WIP, FG) • For a retailer these would include freight costs, purchases, etc. • Period Costs– costs expensed immediately without ever being included in inventory • Selling & administrative costs
Cost Methods: Absorb & Vary Absorption Costing –includes manufacturing overhead in the costs which are assigned to inventory • “Full Costing”, in accordance with GAAP • Costs are classified by function (selling vs. manufacturing) • Inventory costs consider both variable and fixed costs • This method produces a higher inventory value since it includes fixed costs • With this method, fixed manufacturing overhead costs are included in inventory, and a formula is used in order to allocate costs to ‘work-in-process’
Cost Methods: Absorb & Vary Variable Costing – this approach tries harder to separate fixed costs from variable costs and uses a style of income statements which highlights the total fixed costs • “Direct Costing” • Costs are classified by behaviour (variable vs. fixed) • Inventory costs consider only variable costs • This method helps with CVP analyses • Production does not affect operating income under this approach • Under variable costing fixed costs can be attributed to separate divisions and therefore controlled more easily
Absorption vs. Variable ABC Company Absorption Income Statement Sales $75,000 Cost of Goods Sold: Direct Material 10,000 Direct Labour 15,000 Overhead 7,000 Gross Profit $43,000 Selling Expenses 15,000 Admin. Expenses 17,000 Operating Income $11,000 ABC Company Variable Costing Income Statement Sales $75,000 Variable Expenses: Direct Material 10,000 Direct Labour 15,000 Overhead 3,000 Variable Selling 8,000 Variable Admin 8,000 Contribution Margin $31,000 Fixed Expenses: Overhead 4,000 Selling & Admin 16,000 Operating Income $11,000
Absorption vs. Variable • Variable costingstatements are considered easier to understand because net operating income is only affected by changes in unit sales • We cannot do CVP analysis with absorption costingbecause it considers overhead to be a variable cost • Both methods can be used when filing tax returns, but only absorption costingis allowed for external purposes • For absorption costing we use units produced; whereas with variable costing we use units sold
Segmented Income Statements • Income statements for parts of a whole company • A contribution format is used and traceable fixed costs should be separated from common fixed costs to allow for CVP analysis and segment margin calculations • Absorption formation may be used anyway • Traceable fixed costsare fixed costs incurred by that particular segment alone such as the rent for its facility • Common fixed costsare incurred by the whole company such as the executive salaries or patent protection legal fees • Common costs cannot be arbitrarily assigned to segments because managers will be put in charge of costs they have no control over
Segmented Income Statements Segment margin is the best gage of the long-run profitability of a segment Traceable costs of one segment may be common costs to another Not in Handout
Cost Management Systems • Costs are sacrifices of resources for a particular purpose (such as money for materials) • Acost objectiveis a department or product for which cost information is collected • Direct costscan be identified exclusively with a given cost objective (i.e. – a product) in an economical way (can be easily and reliable measured) • Indirect costs cannot... • Overtime premium– an indirect cost which includes wages paid to workers in excess of their regular hours • Idle time– wages paid for unproductive time (when everyone is standing around) • Defects– scrap, warranty claims, the cost of poor customer relationships (if you can figure out a $ for that)
Cost Management Systems • Differential Costs (Revenues) are the difference in cost (revenue) between two alternatives • Example: If you are decided between buying a car that costs $20,000 or buying a bus pass for the next 5 years which will in total cost $15,000 • The differential cost is $5,000 • Opportunity Costsare the potential benefit that is given un when one alternative is selected over another • Example: You are deciding to either buy a car that costs $20,000 or spend the money on a college diploma which would raise your salary from $10,000/year to $25,000/year • The opportunity cost of buying the car would be the $15,000 in increased wages. • Sunk Costsare costs already incurred and paid for that are in the past and cannot be changed and therefore have no bearing on future decisions • Example: If you are decided between buying a car that costs $20,000 or buying a bus pass for the next 5 years which will in total cost $15,000 but you’ve already bought your bus pass for this month which cost $80. • You’ve bought the pass already, it’s in the past and shouldn’t affect your decision here.
Manufacturing Costs Prime Costs Direct Materials Direct Labour Factory Overhead Conversion Costs • For companies who create their inventory from scratch, there are three main categories of costs: • Direct Material Costs– cost of acquiring materials used • Direct Labour Costs – wages or labour that is exclusive to production • Factory Overhead Costs – all other costs (utilities, equipment depreciation, etc.) • These costs can be combined and reduced to two categories • Prime Costsinclude direct labour and material costs • Conversion Costsinclude the costs of converting material into finished products (direct labour and factory overhead costs)
Cost Allocation • Cost Allocationis the process of linking costs or cost pools (multiple costs grouped together) with one or more cost objects through identifying and selecting cost drivers • Synonyms of cost allocation cost tracing, assignments, distributions, apportionment • Synonyms of cost drivers allocation base, activity measure
Manufacturing Overhead Cost Allocation • The POHR is used no matter what the real overhead costs are and what the actual allocation activity is • The per unit cost calculated above ≠ marginal cost of the product; if an additional unit was produced the per unit cost would slightly decrease Journal Entry Examples in “Extras”
Underapplied / Overapplied • Since the POHR contains estimates, the manufacturing overhead that we actually incur and the amount applied to Work in Process using the POHR will differ 99% of the time • Underapplied overhead- overhead applied to jobs is less than the total amount of overhead actually incurred • this will result in a remaining debit balance in the manufacturing overhead account • Overapplied overhead- overhead applied to jobs is greater than the total amount of overhead actually incurred • this will result in a remaining credit balance in the manufacturing overhead account • The difference between applied overhead and actual overhead can be dealt with in three ways: • Close directly to Cost of Goods Sold Expense • Allocate proportionately between WIP, Finished Goods, and COGS Expense • based on their relative dollar value • Carry the balance in manufacturing overhead over to the next year
Overhead Application Example Toyota has incurred a total of $15.0M in manufacturing overhead this month with a total of 500,000 labour hours worked on cars. Calculate the manufacturing overhead applied to Work-in-Progress cars over the month using a predetermined overhead rate of $12/hour. Was the manufacturing overhead overapplied, underapplied, or perfect ? Provide the journal entry required to close any unapplied overhead to cost of goods sold. Step 1: Apply Overhead Applied Overhead = POHR X Actual Direct Labour Hours Applied Overhead = $12/hour X 500,000 Applied Overhead = $6.0M Step 3: Journal Entry Debit : Cost of Goods Sold $9M Credit : Manufacturing Overhead $9M Step 2: Over/Underapplied? = Actual Overhead – Applied Overhead = $15M - $6M = $9M Underapplied
POHR and Capacity • Biggest criticisms of using the POHR: • Using estimates and budgeted activity levels will result in product costs that fluctuate all the time • Applies costs that had nothing to do with products like idle time • Using capacity limits instead of the estimated number of allocation base will reduce the overhead rate • the difference between the capacity rate and the POHR is the idle capacity cost Equipment is leased for $400,000 / year. A plant working at full capacity can produce 80,000 units, but the company estimates 60,000 will be made. The POHR will be $6.67/unit using the regular formula but if we use capacity units instead it will only be $5/unit.
Professional Ethics How will understating the estimated direct labour hours in the base for the POHR affect operating income? Remember: • Artificially high overhead rate • Overapplied overhead debit balance in manufacturing overhead account • This will reduce COGS when the account is closed • This will result in higher net income Not in Handout