Download

1 / 27
270 likes | 400 Views
JustFoodERP. Big Picture Reporting. What does reporting mean to our customers?. Even the toughest problems have solutions!. JustFoodERP Reporting Strategy. Native Reports Business Charts Role Center. Generic Charts Send to Excel Power BI

E N D
JustFoodERP Big Picture Reporting
JustFoodERP Reporting Strategy Native Reports Business Charts Role Center Generic Charts Send to Excel Power BI (Power Pivot, Power View, Power Query, Power Map) Standard Reports and Charts Self-serve Notifications SharePoint Alerts Reporting Services Data Models/Cubes Power BI SharePoint Portals KPIs Dashboards & Insights Business Notifications
Power BI for Office 365 Power Pivot Power View Power Map Power Query
Power BI for Excel Demo
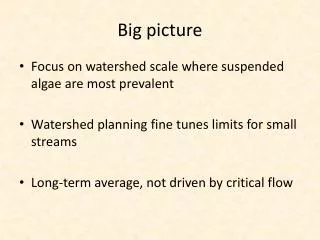
Business Notifications Instead of running reports to identify the issues, have the issues come to you when they happen!
Event Notifications Demo
Only 30% of potential BI users adopt standard BI tools -Forrester Research
Dashboards & Insights SALES RECEIVABLES INVENTORY GENERAL LEDGER PURCHASE PAYABLES ACCOUNT SCHEDULES SALES ORDERS PURCHASE ORDERS MANUFACTURING JOBS AND RESOURCES SERVICE MANAGEMENT FIXED ASSETS WAREHOUSE
Power BI for Office 365 Power Pivot Power View Power Map Power Query
Reporting Strategy Mobility
Access JustFoodERP from any device anywhere using a web browser!!
Free Windows Store App Works with Power BI site on Office 365
Gartner Group Magic Quadrant for Business Intelligence and Analytics Platform “Microsoft has made early investments in its cloud-based BI offering, Power BI. Microsoft's strategy is to use the cloud to increase adoption of its new and most competitive BI capabilities in Excel (starting with Excel 2013), and to accelerate enhancements to Excel to every six months.” - Gartner
JustFoodERP Reporting Strategy Native Reports Business Charts Role Center Generic Charts Send to Excel Power BI (Power Pivot, Power View, Power Query, Power Map) Standard Reports and Charts Self-serve Notifications SharePoint Alerts Reporting Services Data Models/Cubes Power BI SharePoint Portals KPIs Dashboards & Insights Business Notifications