1 / 28

Shares of global ore production in 2001

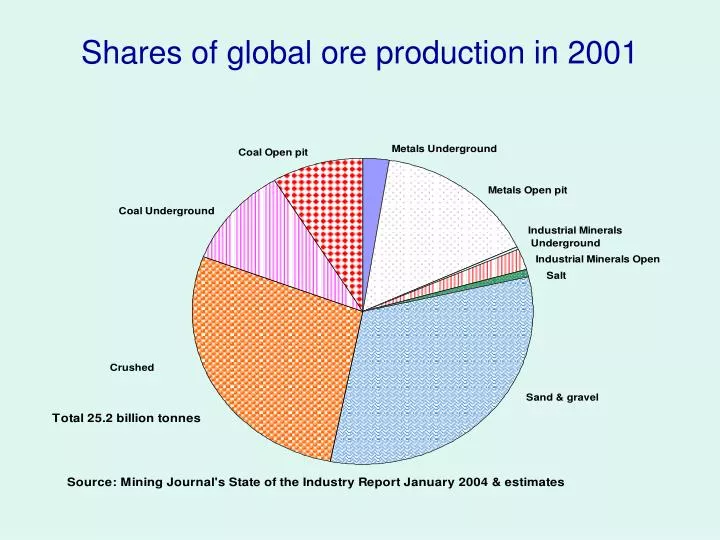
Shares of global ore production in 2001. Global ore & waste output 2001. Global mining & quarrying output 2006. Global non-fuel minerals output in 2006. Global minerals production 2004 & 2006. Growth rates of global minerals output. World minerals production 1979-2006.

Download Presentation

Shares of global ore production in 2001

An Image/Link below is provided (as is) to download presentation Download Policy: Content on the Website is provided to you AS IS for your information and personal use and may not be sold / licensed / shared on other websites without getting consent from its author. Content is provided to you AS IS for your information and personal use only. Download presentation by click this link. While downloading, if for some reason you are not able to download a presentation, the publisher may have deleted the file from their server. During download, if you can't get a presentation, the file might be deleted by the publisher.

E N D

Presentation Transcript


  1. Shares of global ore production in 2001

  2. Global ore & waste output 2001

  3. Global mining & quarrying output 2006

  4. Global non-fuel minerals output in 2006

  5. Global minerals production 2004 & 2006

  6. Growth rates of global minerals output

  7. World minerals production 1979-2006

  8. Annual changes in global GDP and metals consumption 1970-2006

  9. Mineral prices 1979-2006 in real terms

  10. ‘Real’ non-ferrous metal prices

  11. Copper cash costs and prices 1975-2005

  12. Returns on capital employed & US ten year bond yields 1977-2005

  13. Leading producers’ cumulative shares of world production

  14. Consumption of primary aluminium (‘000 tonnes) 1989 19.3Mt 2006 34Mt.

  15. Global non-ferrous metals productivity

  16. Canadian mineral resource development 2005. $Can million

  17. Corporate exploration spending

  18. Australian exploration spending

  19. Crustal abundance & concentration factors

  20. The classification of reserves & resources

  21. Resources, reserve base, & reserves2005

  22. Indices of global reserves

  23. The distribution of copper ore reserves by % grade

  24. The size distribution of mines

  25. The changing location of copper mining 1975 to 2005 Output grew from 7.35Mt in 1975 to 9Mt in 1990 and 14.8Mt in 2005. Fewer countries now mine copper. Chile has surged to the forefront, and Indonesia, Australia & Peru have also gained. Africa and North America have shrunk in importance.

  26. The changing location of zinc mining 1975 to 2005 In 1975 Canada and the USSR were the main producers of the 6.2 Mt mined. There was a broad spread of other producing countries, especially in Europe. By 2005 China was the leading producer of the 10Mt mined. There were fewer producing countries, and output had fallen in Canada & the former USSR.

  27. The changing location of gold mining 1975 to 2005 In 1975 South Africa and the Soviet Union were the dominant producers of the 1190 tonnes mined. By 2005 production of 2450 tonnes was more evenly spread across a much greater range of countries.

  28. Diamonds – mining’s best friend?

More Related