
Uploaded by
sophia-strong
1 SLIDES
115 VIEWS
10LIKES
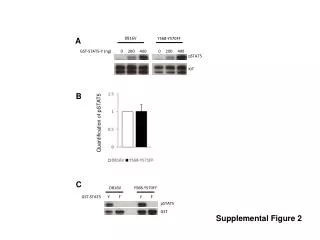
Quantification of pSTAT5 Activity in A.D816V and B.D816V Mutations: Supplemental Figure 2
DESCRIPTION
This supplemental figure (Supplemental Figure 2) presents the quantification of phosphorylated STAT5 (pSTAT5) levels in various cell lines expressing mutations A.D816V and B.D816V. The experimental setup includes GST-STAT5 constructs and involves measuring pSTAT5 levels using specific assays. The data demonstrate how these mutations influence pSTAT5 activation, essential for understanding their role in cellular signaling and oncogenesis. Detailed methodologies and results are provided within the figure for in-depth analysis.
Download
1 / 1
Download Presentation 
Quantification of pSTAT5 Activity in A.D816V and B.D816V Mutations: Supplemental Figure 2
An Image/Link below is provided (as is) to download presentation
Download Policy: Content on the Website is provided to you AS IS for your information and personal use and may not be sold / licensed / shared on other websites without getting consent from its author.
Content is provided to you AS IS for your information and personal use only.
Download presentation by click this link.
While downloading, if for some reason you are not able to download a presentation, the publisher may have deleted the file from their server.
During download, if you can't get a presentation, the file might be deleted by the publisher.
E N D
Presentation Transcript
A D816V Y568-Y570FF B D816V Y568-Y570FF GST-STAT5-Y (ng) 0 200 400 0 200 400 GST-STAT5 Y F Y F pSTAT5 pSTAT5 KIT GST Quantification of pSTAT5 C Supplemental Figure 2
More Related