Download
1 / 13
130 likes | 209 Views
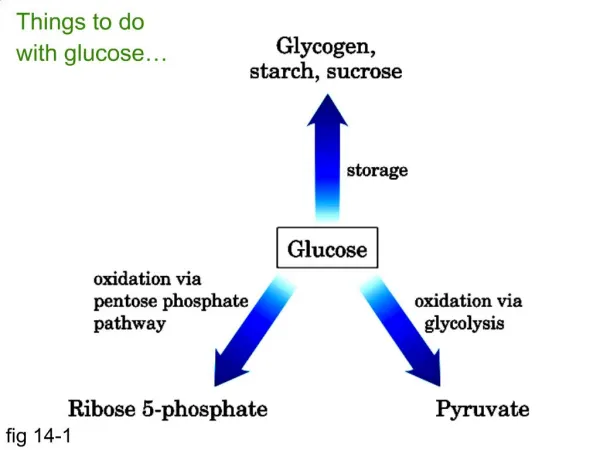
Explore concepts of population growth, births, deaths, immigration, and emigration. Learn about exponential and logistic growth models, population density, and factors influencing birth and death rates. Analyze data on various populations through history.

E N D
(a) Clumped Fig. 53-4 (b) Uniform (c) Random
Births Deaths Fig. 53-3 Births and immigration add individuals to a population. Deaths and emigration remove individuals from a population. Immigration Emigration
8,000 6,000 Fig. 53-11 Elephant population 4,000 2,000 0 1900 1920 1940 1960 1980 Year
2,000 dN 1.0N = dt 1,500 dN 0.5N Fig. 53-10 = dt Population size (N) 1,000 500 0 0 5 10 15 Number of generations
Exponential growth 2,000 dN 1.0N = dt 1,500 Fig. 53-12 K = 1,500 Population size (N) Logistic growth 1,000 1,500 – N dN 1.0N = 1,500 dt 500 0 0 5 10 15 Number of generations
1,000 800 Fig. 53-13a Number of Paramecium/mL 600 400 200 0 0 5 15 10 Time (days) (a) A Paramecium population in the lab
Density-dependent birth rate Density-dependent birth rate Density- independent death rate Density- dependent death rate Birth or death rate per capita Equilibrium density Equilibrium density Fig. 53-15 Population density Population density (a) Both birth rate and death rate vary. (b) Birth rate varies; death rate is constant. Density-dependent death rate Density- independent birth rate Birth or death rate per capita Equilibrium density Population density (c) Death rate varies; birth rate is constant.
Fig. 53-20 Snowshoe hare 160 120 9 Lynx Number of lynx (thousands) Number of hares (thousands) 80 6 40 3 0 0 1850 1875 1900 1925 Year
1,000 I Fig. 53-6 100 II Number of survivors (log scale) 10 III 1 0 50 100 Percentage of maximum life span
Rapid growth Slow growth No growth Afghanistan United States Italy Male Female Age Male Female Age Male Female 85+ 85+ 80–84 80–84 Fig. 53-25 75–79 75–79 70–74 70–74 65–69 65–69 60–64 60–64 55–59 55–59 50–54 50–54 45–49 45–49 40–44 40–44 35–39 35–39 30–34 30–34 25–29 25–29 20–24 20–24 15–19 15–19 10–14 10–14 5–9 5–9 0–4 0–4 10 8 6 4 2 0 2 4 6 8 10 8 6 4 2 0 2 4 6 8 8 6 4 2 0 2 4 6 8 Percent of population Percent of population Percent of population
7 6 5 Fig. 53-22 4 Human population (billions) 3 2 The Plague 1 0 8000 B.C.E. 4000 B.C.E. 3000 B.C.E. 2000 B.C.E. 1000 B.C.E. 0 1000 C.E. 2000 C.E.