Download
1 / 43
430 likes | 437 Views
According to MarkNtel Advisorsu2019 research report titled u201cGlobal Blockchain Market Analysis, 2020u201d, the Global Blockchain market is anticipated to grow at a CAGR of around 73.1% during 2020-25F.

E N D
Global Blockchain Market Analysis, 2020 marknteladvisors.com
Document Outline Introduction About Us, Key Questions Answered In This Study 02 Table of Content Market Segmentation, Scope of Work 05 Research Process & Methodology Primary Research, Secondary Research, Companies Interviewed, Respondent Profile, Research Methodology, Forecasting 26 Sample Pages Global Blockchain Market Analysis, 2020 34 83 Commercials 85 Disclaimer 2 Copyright 2020. Reproduction is forbidden unless authorized. All rights reserved.
MarkNtel Advisors LLP 700+ MarkNtel Advisors LLP is a premier market/business research, consulting, and analytics center known for its incessant real time support. We work 24*7 to ensure Research, Consulting, Advisory & Data Analytics Studies Delivered that our clients meet their objectives. A continuous improvement in customer experience is our foremost priority. 200+ We deliver research, consulting and data analytics services across industries including Information & Communication Technology, Consumer Goods & Retail, Global Clients Served Across Industries & Geographies FinTech, Building & Construction, Automotive, Chemicals & Materials, Oil & Gas, Power & Utilities, Banking & Financial Services, etc. 70+ We understand the growing need of our clients, and thus focus on emerging industries to provide our services which can fulfill their need of assessing the current Team of experienced analysts (FTEs) and future Market potential, identification of white spaces & hotspots and venturing into new geographies or business segments. 15+ We specialize in niche industries and emerging geographies to support our clients in Sectoral Research Coverage formulation of strategies viz. Go to Market (GTM), Product Development, Technology Upgradation, Customer Analytics, Trend Analysis, Sales Analytics, etc. to enable them 90%+ in identifying attractive investment opportunities and maximizing ROI through an early mover advantage. Customer Satisfaction Rate 3 Copyright 2020. Reproduction is forbidden unless authorized. All rights reserved.
Document Outline Introduction About Us, Key Questions Answered In This Study 02 Table of Content Market Segmentation, Scope of Work 05 Research Process & Methodology Primary Research, Secondary Research, Companies Interviewed, Respondent Profile, Research Methodology, Forecasting 26 Sample Pages Global Blockchain Market Analysis, 2020 34 83 Commercials 85 Disclaimer 4 Copyright 2020. Reproduction is forbidden unless authorized. All rights reserved.
Market Segmentation Global Blockchain Market Segmentation By Component By Application By End User By Region North America o The US o Canada o Mexico South America o Brazil o Others Middle East & Africa o UAE o Saudi Arabia o South Africa o Israel o Others Europe o Germany o The UK o France o Spain o Switzerland o Others Asia-Pacific o China o India o Japan o Australia o South Korea o Singapore o Others • Manufacturing Government & Transportation Logistics Healthcare & Lifescience Energy & Utilities Media & Entertainment BFSI IT & Telecom Retail & Ecommerce Others (Agriculture, etc.) • • Payment Documentation Exchanges Supply Chain Management Digital Identity Smart Contracts Others (Advertising insights, etc.) • • • • Services o Consultation o Development & Integration o Support & Maintenance Platform • • • • • • • • • • • • • • • • • By Provider By Organization By Type By Company IBM AWS Microsoft SAP Intel Oracle NTT Data Earthport Consensys Huawei Monax Ripple Interbit R3 BitFury • • • • • • • • • • • • • • • Application Provider Infrastructure Provider Middleware Provider Small Medium Large Private Public Hybrid • • • • • • • • • 5 Copyright 2020. Reproduction is forbidden unless authorized. All rights reserved.
Historical Year: 2015 Base Year: 2019 Table of Content (1/19) Forecast Year: 2025 Table of Content 1. Introduction 1.1. Product Definition 1.2. Research Process 1.3. Market Segmentation 1.4. Assumptions 2. Executive Summary 3. Blockchain Ecosystem 4. Global Blockchain Startup Ecosystem 5. Global Blockchain Market Business Cases 6. Customer Survey 7. Impact of COVID-19 on Global Blockchain Market 8. Expert Verbatim-Interview Excerpts of industry experts 9. Global Blockchain Market Outlook, 2015-2025F 9.1. Market Size & Analysis 9.1.1. Revenues 9.2. Market Share & Analysis 9.2.1. By Component 9.2.1.1. Services 9.2.1.1.1. Consultation 9.2.1.1.2. Development & Integration 6 Copyright 2020. Reproduction is forbidden unless authorized. All rights reserved.
Historical Year: 2015 Base Year: 2019 Table of Content (2/19) Forecast Year: 2025 Table of Content 9.2.1.1.3. Support & Maintainence 9.2.1.2. Platform 9.2.2. By Provider 9.2.2.1. Application Provider 9.2.2.2. Infrastructure Provider 9.2.2.3. Middleware Provider 9.2.3. By Type 9.2.3.1. Private 9.2.3.2. Public 9.2.3.3. Hybrid 9.2.4. By Organization 9.2.4.1. Small 9.2.4.2. Medium 9.2.4.3. Large 9.2.5. By Application 9.2.5.1. Payment 9.2.5.2. Documentation 9.2.5.3. Exchanges 9.2.5.4. Supply Chain Management 9.2.5.5. Digital Identity 7 Copyright 2020. Reproduction is forbidden unless authorized. All rights reserved.
Historical Year: 2015 Base Year: 2019 Table of Content (3/19) Forecast Year: 2025 Table of Content 9.2.5.6. Smart Contracts 9.2.5.7. Others (Advertising insights, etc.) 9.2.6. By End User 9.2.6.1. Manufacturing 9.2.6.2. Government & Transportation 9.2.6.3. Logistics 9.2.6.4. Healthcare & Lifescience 9.2.6.5. Energy & Utilities 9.2.6.6. Media & Entertainment 9.2.6.7. BFSI 9.2.6.8. IT & Telecom 9.2.6.9. Retail & E-commerce 9.2.6.10. Others (Agriculture, etc.) 9.2.7. By Region 9.2.7.1. North America 9.2.7.2. South America 9.2.7.3. Europe 9.2.7.4. Middle East & Africa 9.2.7.5. Asia-Pacific 9.2.8. By Company 8 Copyright 2020. Reproduction is forbidden unless authorized. All rights reserved.
Historical Year: 2015 Base Year: 2019 Table of Content (4/19) Forecast Year: 2025 Table of Content 9.2.8.1. Market Shares, By Revenue 9.2.8.2. Strategic Factorial Indexing 9.2.8.3. Competitor Placement in MarkNtel Quadrant 9.3. Market Attractiveness Index 9.3.1. By Component 9.3.2. By Provider 9.3.3. By Type 9.3.4. By Organization 9.3.5. By Application 9.3.6. By End User 9.3.7. By Region 10. North America Blockchain Market Outlook, 2015-2025F 10.1. Market Size & Analysis 10.1.1. Revenues 10.2. Market Share & Analysis 10.2.1. By Component 10.2.2. By Provider 10.2.3. By Type 10.2.4. By Organization 10.2.5. By Application 9 Copyright 2020. Reproduction is forbidden unless authorized. All rights reserved.
Historical Year: 2015 Base Year: 2019 Table of Content (5/19) Forecast Year: 2025 Table of Content 10.2.6. By End User 10.2.7. By Country 10.2.7.1. The US 10.2.7.2. Canada 10.2.7.3. Mexico 10.3. The US Blockchain Market Outlook, 2015-2025F 10.3.1. Market Size & Analysis 10.3.1.1. Revenues 10.3.2. Market Share & Analysis 10.3.2.1. By Component 10.3.2.2. By Provider 10.3.2.3. By Type 10.3.2.4. By Organization 10.3.2.5. By Application 10.3.2.6. By End User 10.4. Canada Blockchain Market Outlook, 2015-2025F 10.4.1. Market Size & Analysis 10.4.1.1. Revenues 10.4.2. Market Share & Analysis 10.4.2.1. By Component 10 Copyright 2020. Reproduction is forbidden unless authorized. All rights reserved.
Historical Year: 2015 Base Year: 2019 Table of Content (6/19) Forecast Year: 2025 Table of Content 10.4.2.2. By Provider 10.4.2.3. By Type 10.4.2.4. By Organization 10.4.2.5. By Application 10.4.2.6. By End User 10.5. Mexico Blockchain Market Outlook, 2015-2025F 10.5.1. Market Size & Analysis 10.5.1.1. Revenues 10.5.2. Market Share & Analysis 10.5.2.1. By Component 10.5.2.2. By Provider 10.5.2.3. By Type 10.5.2.4. By Organization 10.5.2.5. By Application 10.5.2.6. By End User 11. South America Blockchain Market Outlook, 2015-2025F 11.1. Market Size & Analysis 11.1.1. Revenues 11.2. Market Share & Analysis 11.2.1. By Component 11 Copyright 2020. Reproduction is forbidden unless authorized. All rights reserved.
Historical Year: 2015 Base Year: 2019 Table of Content (7/19) Forecast Year: 2025 Table of Content 11.2.2. By Provider 11.2.3. By Type 11.2.4. By Organization 11.2.5. By Application 11.2.6. By End User 11.2.7. By Country 11.2.7.1. Brazil 11.2.7.2. Others 11.3. Brazil Blockchain Market Outlook, 2015-2025F 11.3.1. Market Size & Analysis 11.3.1.1. Revenues 11.3.2. Market Share & Analysis 11.3.2.1. By Component 11.3.2.2. By Provider 11.3.2.3. By Type 11.3.2.4. By Organization 11.3.2.5. By Application 11.3.2.6. By End User 12. Europe Blockchain Market Outlook, 2015-2025F 12.1. Market Size & Analysis 12 Copyright 2020. Reproduction is forbidden unless authorized. All rights reserved.
Historical Year: 2015 Base Year: 2019 Table of Content (8/19) Forecast Year: 2025 Table of Content 12.1.1. Revenues 12.2. Market Share & Analysis 12.2.1. By Component 12.2.2. By Provider 12.2.3. By Type 12.2.4. By Organization 12.2.5. By Application 12.2.6. By End User 12.2.7. By Country 12.2.7.1. Germany 12.2.7.2. The UK 12.2.7.3. France 12.2.7.4. Spain 12.2.7.5. Switzerland 12.2.7.6. Others 12.3. Germany Blockchain Market Outlook, 2015-2025F 12.3.1. Market Size & Analysis 12.3.1.1. Revenues 12.3.2. Market Share & Analysis 12.3.2.1. By Component 13 Copyright 2020. Reproduction is forbidden unless authorized. All rights reserved.
Historical Year: 2015 Base Year: 2019 Table of Content (9/19) Forecast Year: 2025 Table of Content 12.3.2.2. By Provider 12.3.2.3. By Type 12.3.2.4. By Organization 12.3.2.5. By Application 12.3.2.6. By End User 12.4. The UK Blockchain Market Outlook, 2015-2025F 12.4.1. Market Size & Analysis 12.4.1.1. Revenues 12.4.2. Market Share & Analysis 12.4.2.1. By Component 12.4.2.2. By Provider 12.4.2.3. By Type 12.4.2.4. By Organization 12.4.2.5. By Application 12.4.2.6. By End User 12.5. France Blockchain Market Outlook, 2015-2025F 12.5.1. Market Size & Analysis 12.5.1.1. Revenues 12.5.2. Market Share & Analysis 12.5.2.1. By Component 14 Copyright 2020. Reproduction is forbidden unless authorized. All rights reserved.
Historical Year: 2015 Base Year: 2019 Table of Content (10/19) Forecast Year: 2025 Table of Content 12.5.2.2. By Provider 12.5.2.3. By Type 12.5.2.4. By Organization 12.5.2.5. By Application 12.5.2.6. By End User 12.6. Spain Blockchain Market Outlook, 2015-2025F 12.6.1. Market Size & Analysis 12.6.1.1. Revenues 12.6.2. Market Share & Analysis 12.6.2.1. By Component 12.6.2.2. By Provider 12.6.2.3. By Type 12.6.2.4. By Organization 12.6.2.5. By Application 12.6.2.6. By End User 12.7. Switzerland Blockchain Market Outlook, 2015-2025F 12.7.1. Market Size & Analysis 12.7.1.1. Revenues 12.7.2. Market Share & Analysis 12.7.2.1. By Component 15 Copyright 2020. Reproduction is forbidden unless authorized. All rights reserved.
Historical Year: 2015 Base Year: 2019 Table of Content (11/19) Forecast Year: 2025 Table of Content 12.7.2.2. By Provider 12.7.2.3. By Type 12.7.2.4. By Organization 12.7.2.5. By Application 12.7.2.6. By End User 13. Middle East & Africa Blockchain Market Outlook, 2015-2025F 13.1. Market Size & Analysis 13.1.1. Revenues 13.2. Market Share & Analysis 13.2.1. By Component 13.2.2. By Provider 13.2.3. By Type 13.2.4. By Organization 13.2.5. By Application 13.2.6. By End User 13.2.7. By Country 13.2.7.1. UAE 13.2.7.2. Saudi Arabia 13.2.7.3. South Africa 13.2.7.4. Israel 16 Copyright 2020. Reproduction is forbidden unless authorized. All rights reserved.
Historical Year: 2015 Base Year: 2019 Table of Content (12/19) Forecast Year: 2025 Table of Content 13.2.7.5. Others 13.3. UAE Blockchain Market Outlook, 2015-2025F 13.3.1. Market Size & Analysis 13.3.1.1. Revenues 13.3.2. Market Share & Analysis 13.3.2.1. By Component 13.3.2.2. By Provider 13.3.2.3. By Type 13.3.2.4. By Organization 13.3.2.5. By Application 13.3.2.6. By End User 13.4. Saudi Arabia Blockchain Market Outlook, 2015-2025F 13.4.1. Market Size & Analysis 13.4.1.1. Revenues 13.4.2. Market Share & Analysis 13.4.2.1. By Component 13.4.2.2. By Provider 13.4.2.3. By Type 13.4.2.4. By Organization 13.4.2.5. By Application 17 Copyright 2020. Reproduction is forbidden unless authorized. All rights reserved.
Historical Year: 2015 Base Year: 2019 Table of Content (13/19) Forecast Year: 2025 Table of Content 13.4.2.6. By End User 13.5. South Africa Blockchain Market Outlook, 2015-2025F 13.5.1. Market Size & Analysis 13.5.1.1. Revenues 13.5.2. Market Share & Analysis 13.5.2.1. By Component 13.5.2.2. By Provider 13.5.2.3. By Type 13.5.2.4. By Organization 13.5.2.5. By Application 13.5.2.6. By End User 13.6. Israel Blockchain Market Outlook, 2015-2025F 13.6.1. Market Size & Analysis 13.6.1.1. Revenues 13.6.2. Market Share & Analysis 13.6.2.1. By Component 13.6.2.2. By Provider 13.6.2.3. By Type 13.6.2.4. By Organization 13.6.2.5. By Application 18 Copyright 2020. Reproduction is forbidden unless authorized. All rights reserved.
Historical Year: 2015 Base Year: 2019 Table of Content (14/19) Forecast Year: 2025 Table of Content 13.6.2.6. By End User 14. Asia-Pacific Blockchain Market Outlook, 2015-2025F 14.1. Market Size & Analysis 14.1.1. Revenues 14.2. Market Share & Analysis 14.2.1. By Component 14.2.2. By Provider 14.2.3. By Type 14.2.4. By Organization 14.2.5. By Application 14.2.6. By End User 14.2.7. By Country 14.2.7.1. China 14.2.7.2. India 14.2.7.3. Australia 14.2.7.4. Japan 14.2.7.5. South Korea 14.2.7.6. Singapore 14.2.7.7. Others 14.3. China Blockchain Market Outlook, 2015-2025F 19 Copyright 2020. Reproduction is forbidden unless authorized. All rights reserved.
Historical Year: 2015 Base Year: 2019 Table of Content (15/19) Forecast Year: 2025 Table of Content 14.3.1. Market Size & Analysis 14.3.1.1. Revenues 14.3.2. Market Share & Analysis 14.3.2.1. By Component 14.3.2.2. By Provider 14.3.2.3. By Type 14.3.2.4. By Organization 14.3.2.5. By Application 14.3.2.6. By End User 14.4. India Blockchain Market Outlook, 2015-2025F 14.4.1. Market Size & Analysis 14.4.1.1. Revenues 14.4.2. Market Share & Analysis 14.4.2.1. By Component 14.4.2.2. By Provider 14.4.2.3. By Type 14.4.2.4. By Organization 14.4.2.5. By Application 14.4.2.6. By End User 14.5. Australia Blockchain Market Outlook, 2015-2025F 20 Copyright 2020. Reproduction is forbidden unless authorized. All rights reserved.
Historical Year: 2015 Base Year: 2019 Table of Content (16/19) Forecast Year: 2025 Table of Content 14.5.1. Market Size & Analysis 14.5.1.1. Revenues 14.5.2. Market Share & Analysis 14.5.2.1. By Component 14.5.2.2. By Provider 14.5.2.3. By Type 14.5.2.4. By Organization 14.5.2.5. By Application 14.5.2.6. By End User 14.6. Japan Blockchain Market Outlook, 2015-2025F 14.6.1. Market Size & Analysis 14.6.1.1. Revenues 14.6.2. Market Share & Analysis 14.6.2.1. By Component 14.6.2.2. By Provider 14.6.2.3. By Type 14.6.2.4. By Organization 14.6.2.5. By Application 14.6.2.6. By End User 14.7. South Korea Blockchain Market Outlook, 2015-2025F 21 Copyright 2020. Reproduction is forbidden unless authorized. All rights reserved.
Historical Year: 2015 Base Year: 2019 Table of Content (17/19) Forecast Year: 2025 Table of Content 14.7.1. Market Size & Analysis 14.7.1.1. Revenues 14.7.2. Market Share & Analysis 14.7.2.1. By Component 14.7.2.2. By Provider 14.7.2.3. By Type 14.7.2.4. By Organization 14.7.2.5. By Application 14.7.2.6. By End User 14.8. Singapore Blockchain Market Outlook, 2015-2025F 14.8.1. Market Size & Analysis 14.8.1.1. Revenues 14.8.2. Market Share & Analysis 14.8.2.1. By Component 14.8.2.2. By Provider 14.8.2.3. By Type 14.8.2.4. By Organization 14.8.2.5. By Application 14.8.2.6. By End User 15. Global Blockchain Market Policies, Regulations, Product Standards 22 Copyright 2020. Reproduction is forbidden unless authorized. All rights reserved.
Historical Year: 2015 Base Year: 2019 Table of Content (18/19) Forecast Year: 2025 Table of Content 16. Global Blockchain Market Trends & Insights 17. Global Blockchain Market Dynamics 17.1. Growth Drivers 17.2. Challenges 17.3. Impact Analysis 18. Global Blockchain Market Hotspot & Opportunities 19. Global Blockchain Market Key Strategic Imperatives for Success & Growth 20. Competition Outlook 20.1. Competition Matrix 20.1.1. Product/Service Portfolio 20.1.2. Target Markets 20.1.3. Target End Users 20.1.4. Research & Development 20.1.5. Strategic Alliances 20.1.6. Strategic Initiatives 20.2. Company Profiles of top companies (Business Description, Product Segments, Business Segments, Financials, Strategic Alliances/ Partnerships, Future Plans) 20.2.1. IBM 20.2.2. AWS 20.2.3. Microsoft 20.2.4. SAP 23 Copyright 2020. Reproduction is forbidden unless authorized. All rights reserved.
Historical Year: 2015 Base Year: 2019 Table of Content (19/19) Forecast Year: 2025 Table of Content 20.2.5. Intel 20.2.6. Oracle 20.2.7. NTT Data 20.2.8. Earthport 20.2.9. Consensys 20.2.10. Huawei 20.2.11. Monax 20.2.12. Ripple 20.2.13. Interbit 20.2.14. R3 20.2.15. BitFury 21. Disclaimer 24 Copyright 2020. Reproduction is forbidden unless authorized. All rights reserved.
Global Blockchain Market Outlook, 2015-2025F Copyright 2020. Reproduction is forbidden unless authorized. All rights reserved.
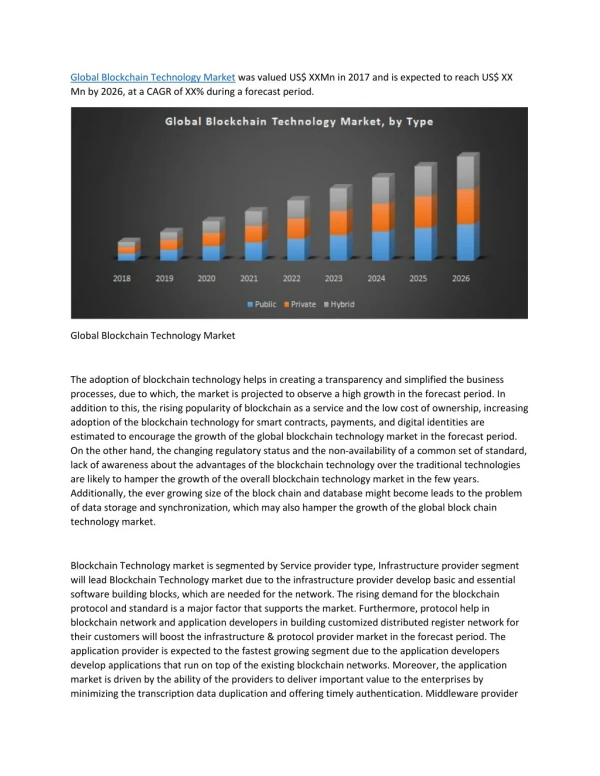
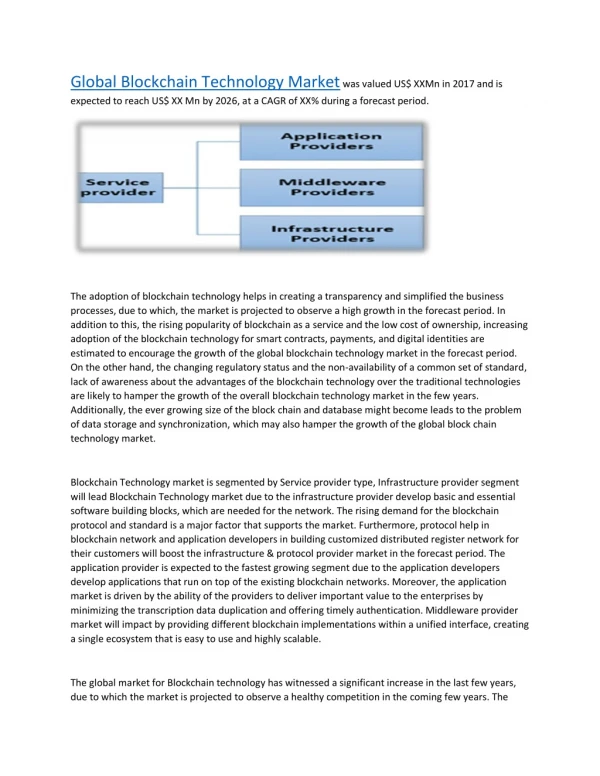
Global Blockchain Market Outlook, By Revenues Figure XX: Global Blockchain Market Revenues (USD Million), 2015 - 2025F Revenue: XX% Revenue: XX% CAGR CAGR 2015 2016 2017 2018 2019 2020E 2021F 2022F 2023F 2024F 2025F Source: MarkNtel Advisors • The global blockchain market is experiencing tremendous growth from the past few years due to the rising adoption of IoT devices. Connected devices associate with network permanently and comprise sensors that help to synchronize activities, this generated the requirement of security. Blockchain offers a scalable framework for quick and secure communication among connected devices. Thereby, the demand for blockchain is surgingacross the globe. • COVID-19 has soared the usage of blockchain in certain specific areas inclusive of essential products and services. The organizations are adopting blockchain for supply chain management, disaster relief, insurance, and contract tracing, etc. worldwide. Blockchain assists in contract tracing through collect and protect patients' information as well as monitor their movements more efficiently to ensure social distancing. These are few of theseveral other factors that increased blockchain deployment globally. 26 Copyright 2020. Reproduction is forbidden unless authorized. All rights reserved.
Global Blockchain Market Revenue Share, By Component Figure XX: Global Blockchain Market Revenue Share (%), By Component, 2015- 2025F 2015 2016 2017 2018 2019 2020 2021 2022 2023 2024 2025 Services Platform Source: MarkNtel Advisors *These are dummy charts and do not represent actual value • Platform: This segment is anticipated to dominate the global blockchain market during the forecast years 2020-25. The early adoption of blockchain in North America, Europe and Middle East region coupled with government initiative is generating huge potential for blockchain service providers in the comingyears. o For instance: UAE government launched an Emirates Blockchain Strategy 2021 in the year 2018. This facilitates around half of the government transactions on the blockchain platform by 2021. • The rising number of startups in several industries such as IT, healthcare, E-Commerce, etc. across the globe is expected to boost the demand for blockchain platforms during the forecast years owing to features such as ease in currency conversion and declining money transfer cost. 27 Copyright 2020. Reproduction is forbidden unless authorized. All rights reserved.
Global Blockchain Market Revenue Share, By Provider Figure XX: Global Blockchain Market Revenue Share (%), By Provider, 2019& 2025F Application Provider 2019 2025F Infrastructure Provider Middleware Provider Source: MarkNtel Advisors *These are dummy charts and do not represent actual value • Middleware Provider: In the Middle East, particularly in the emirates including UAE, Saudi and Oman have their free economic zones that spur countries to adopt advanced technologies. The availability of large oil & gas companies in the Middle East region is driving the demand for blockchain software from the past few years. This is projected to increase the market share of the middleware provider segment over the next 5 years. For instance: Abu Dhabi National Oil Company (ADNOC) collaborated with IBM to implemented a blockchain-based automatedsystem to manage theproductionof oil & gas across all the facilities. • China government launched the National Blockchain Network in 100 Cities in an alliance with banks and IT companies in 2020, which expected to decline 80% operational cost of blockchain business. These mega initiatives are anticipated to attract a large number of startups in thecountry,whichin turn wouldproliferate thedemand for blockchain middleware providersin theforthcomingyears. 28 Copyright 2020. Reproduction is forbidden unless authorized. All rights reserved.
Global Blockchain Market Size, By Type Figure XX: Global Blockchain Market Size (USD Million),By Type, 2019 & 2025F 2019 2025F Private Private Public Public Hybrid Hybrid Source: MarkNtel Advisors *These are dummy charts and do not represent actual value • Private: The private segment is expected to dominate the global market during the forecast years. The demand for private blockchain is driving due to increased scalability and improved privacy over the public blockchain. The demand for private blockchain is high among organizations that deal with confidential information and this needs to be shared among concerned individuals or companies. Hence, BFSI, government, healthcare are the major end-users of private blockchain technology, the rising demand for blockchain in such industries is expected tosurge themarket share of the privatesegment in the coming years. • Healthcare sector majorly use blockchain for operation management, managing and sharing patients' data across different healthcare professionals and companies. Various healthcare companies are practicing blockchain and planned to adopt this technology in the coming years. Thisis anticipated to increase thedemand for private blockchain and subsequently supportthe segment to growthrough2025. 29 Copyright 2020. Reproduction is forbidden unless authorized. All rights reserved.
Global Blockchain Market Revenue Share, By Organization Figure XX: Global Blockchain Market Revenue Share (%), By Organization, 2015- 2025F 2015 2016 2017 2018 2019 2020 2021 2022 2023 2024 2025 Small Medium Large Source: MarkNtel Advisors *These are dummy charts and do not represent actual value • Large: Manufacturing companies face various challenges related to supply chain management, product quality, logistic, etc. across the globe. Blockchain has demonstrated the capabilities to resolve these problems to assist manufacturers in supply chain monitoring, regulatory compliance, asset tracking, identity management, counterfeit detection, and materials provenance, etc. Therefore, it is projectedthe demand for blockchain technologyis supposed tosurge among largemanufacturers worldwideover the next 5 years. • The increasing adoption of additive manufacturing among large organizations also support the growth of the blockchain. With the deployment of additive manufacturing solutions the risk of security vulnerabilities also grow manifold, therefore manufacturers blockchain technology is expected to play an anchor role to eliminate the security threat and modernize project management across the global operations oflarge enterprises. 30 Copyright 2020. Reproduction is forbidden unless authorized. All rights reserved.
Global Blockchain Market Revenue Share, By Application Figure XX: Global Blockchain Market Revenue Share (%), By Application, 2019& 2025F • Payment: This segment is rising at a significant rate over the past few years. The trend of cashless transactions is growing worldwide particularly in the regions including North America, Western Europe, and East Asia, which is supposed to generate the demand for blockchain wallet among organizations during the forecast years 2020-25. Consequently, the market share of the payment segment is expected to rise over the next year. • Australia is supposed to be completely cashless by the year 2020 as per Westpac. • The use of cryptocurrency is still in the nascent stage across the globe, the growing digitalization worldwide is expected to add more demand for cryptocurrency in the coming years. Blockchain platform used for transactionsin the crypto sector, thereby projected that the surging demand for cryptocurrencies would propel the demand for blockchain wallet by 2025. Payment 2019 2025 XX% XX% Others Documentation 2019 2025 2019 2025 XX% XX% XX% XX% 2019: USD XX Million Smart Contracts Exchanges 2019 2025 2019 2025 XX% XX% XX% XX% Digital Identity Supply Chain Management 2019 2025 2019 2025 XX% XX% XX% XX% Source: MarkNtel Advisors 31 Copyright 2020. Reproduction is forbidden unless authorized. All rights reserved.
Global Blockchain Market Revenue Share, By End User Figure XX: Global Blockchain Market Revenue Share (%), By End User, 2019 & 2025F • BFSI: This segment is anticipated to dominate the global blockchain market over the next 5 years. Blockchain assists in the execution of decentralized agreements through smart contracts, decline the risk of fraud through error-free claim evaluation, facilitate quick, payments, eliminate delays and intermediaries failures, etc. With the increasing fraudulent activities, surging cross border transactions and trade finance across the globe are driving the demand for blockchain in the BFSI sector and subsequently contribute to the maximum market share of the segment. • The Banking Royal Commission of Australia recommended the BFSI sector in 2019 to maintain transparency and accountability in the business to eliminate fraudulent activities, this generated requirement of blockchain among BFSI companies. Moreover, the Australian government unveiled 5 years blockchain roadmap in 2020 in which banking is among the top priority sectors. This expected to augment the demand for blockchain technology in the BFSI industry by 2025. 2019 2025F low-cost international Manufacturing Government & Transportation Logistics Healthcare & Lifescience Energy & Utilities Media & Entertainment BFSI IT & Telecom Retail & E-commerce Others (Agriculture, etc.) Source: MarkNtel Advisors *These are dummy charts and do not represent actual value 32 Copyright 2020. Reproduction is forbidden unless authorized. All rights reserved.
Global Blockchain Market Revenue Share, By Region Figure XX: Global Blockchain Market Revenue Share (%), By Region, 2019& 2025F 2019: X% 2025F: X% Europe North America 2019: X% Asia Pacific 2025F: X% 2019: X% Middle East & Africa 2025F: X% South America 2019: X% 2019: X% 2025F: X% 2025F: X% Source: MarkNtel Advisors 33 Copyright 2020. Reproduction is forbidden unless authorized. All rights reserved.
Global Blockchain Market Revenue Share, By Company Figure XX: Global Blockchain Market Revenue Share (%), By Company, 2019 Others (USD XXXX Million) IBM (USD XXX Million) XXXX The companies offer blockchain solutions and services for applications. a broad range of XX XX XXXX XXXX The company services to several industries worldwide. XX Oracle (USD XXXX Million) AWS (USD XXX Million) XX USD XX Billion XXXXX XXXXX XXXXX XXXXX XXXXX XXXXX XX XX SAP (USD XXX Million) Microsoft (USD XXX Million) XXXXXX XXXXX XXXXXX XXXXX XXXXXX XXXXX Source: MarkNtel Advisors Primary Surveys, Annual Reports, Press Releases 34 Copyright 2020. Reproduction is forbidden unless authorized. All rights reserved.
North America Blockchain Market Outlook, 2015-2025F Copyright 2020. Reproduction is forbidden unless authorized. All rights reserved.
North America Blockchain Market Outlook, By Revenues Figure XX: North America Blockchain Market Revenues (USD Million), 2015 - 2025F Revenue: XX% Revenue: XX% CAGR CAGR 2015 2016 2017 2018 2019 2020E 2021F 2022F 2023F 2024F 2025F Source: MarkNtel Advisors • North America is expected to dominate the global blockchain market during in the forthcoming years. The government’s favorable regulations on the use of blockchain have been increasing its application in various industries such as IT, telecommunication, advertising, etc. Moreover, the increased adoptionof thelatest technologiesin theregion is expected to flourish thedemand for blockchain by 2025. • The presence of large manufacturing corporations and proliferating research and development in the region have been generating a large amount of data that need to be managed efficiently and shared with concerned organizations. This drives the demand for blockchain among manufacturing and research companies and supportingthe North America market to growfrom thepast few years. • The increasing adoption of blockchain in the banking sector to ease the cross-border payment, decline in operational cost, enhance productivity,and performance ofthe banks is expected to drive the NorthAmerican blockchain market in the years tocome. 36 Copyright 2020. Reproduction is forbidden unless authorized. All rights reserved.
North America Blockchain Market Revenue Share, By Component Figure XX: North America Blockchain Market Revenue Share (%), By Component, 2015 - 2025F 2015 2016 2017 2018 2019 2020 2021 2022 2023 2024 2025 Services Platform Source: MarkNtel Advisors *These are dummy charts and do not represent actual value • Service: The demand for consultation and integration is rising huge opportunity for blockchain as service providers in the region. The inaccessibility of equivalent technology for securing the digital identity of individuals is expected to generate the demand for blockchain for digital identity management. The requirement of consultation and integration go across with the rising demand for blockchain, therefore, expected that theservice segment wouldsurgeover the next 5 years. • Canadian Securities Administrators considered blockchain among the strategic business goals for 2019-2022. This would generate the demand for blockchain integration by 2022and consequently, wouldsupportthe service segment to growfurther in the coming years. 37 Copyright 2020. Reproduction is forbidden unless authorized. All rights reserved.
North America Blockchain Market Revenue Share & Market Size, By Provider Figure XX: North America Blockchain Market Revenue Share (%) & Market Size (USD Million), By Provider, 2019& 2025F Application Provider 2019 2025F Infrastructure Provider Middleware Provider Source: MarkNtel Advisors *These are dummy charts and do not represent actual value Type 2019 2025F CAGR (2020-25) Application Provider XX XX XX% Infrastructure Provider XX XX XX% Middleware Provider XX XX XX% 38 Copyright 2020. Reproduction is forbidden unless authorized. All rights reserved.
North America Blockchain Market Size, By Type Figure XX: Global Blockchain Market Size (USD Million),By Type, 2019 & 2025F 2019 2025F Private Private Public Public Hybrid Hybrid Source: MarkNtel Advisors *These are dummy charts and do not represent actual value • Private: The government’s regulations in North American countries and emphasis to streamline military warehousing, authenticate government contract bids, assist law enforcement, and encourage transparency of government grants have been promulgating the demand for privateblockchain. Such applicationsincludeconfidential information, therefore, require secure technology. • The use of cryptocurrency is increasing in the region, which may lead to its use in illegal activities. To eliminate such risk, the government is expected to encourage the organizations for adopting privacy-centric blockchain technology.Hence, estimated that the market share of a private segment wouldsurgein the coming years. 39 Copyright 2020. Reproduction is forbidden unless authorized. All rights reserved.
North America Blockchain Market Revenue Share & Market Size, By Organization Figure XX: Global Blockchain Market Revenue Share (%) & Market Size (USD Million),By Organization, 2015- 2025F 2015 2016 2017 2018 2019 2020 2021 2022 2023 2024 2025 Small Medium Large Source: MarkNtel Advisors *These are dummy charts and do not represent actual value CAGR (2020-25) Type 2015 2016 2017 2018 2019 2020 2021 2022 2023 2024 2025F Small XX XX XX XX XX XX XX XX XX XX XX XX% Medium XX XX XX XX XX XX XX XX XX XX XX XX% Large XX XX XX XX XX XX XX XX XX XX XX XX% 40 Copyright 2020. Reproduction is forbidden unless authorized. All rights reserved.
North America Blockchain Market Revenue Share & Market Size, By Application Figure XX: North America Blockchain Market Revenue Share (%) & Market Size (USD Million), By Application, 2019& 2025F Payment CAGR Type 2019 2025F 2019 2025 (2020-25F) XX% XX% Others Documentation Payment XX XX XX% 2019 2025 2019 2025 Documentation XX XX XX% XX% XX% XX% XX% Exchanges XX XX XX% 2019: USD XX Million Supply Chain Management XX XX XX% Smart Contracts Exchanges 2019 2025 2019 2025 Digital Identity XX XX XX% XX% XX% XX% XX% Smart Contracts XX XX XX% Digital Identity Supply Chain Management Others XX XX XX% 2019 2025 2019 2025 XX% XX% XX% XX% Source: MarkNtel Advisors 41 Copyright 2020. Reproduction is forbidden unless authorized. All rights reserved.
North America Blockchain Market Revenue Share, By End User Figure XX: North America Blockchain Market Revenue Share (%), By End User, 2019& 2025F • Retail & E-Commerce: The increased focus of retail companies towards personal identity, data management, online security for the communication among retailers and customers is driving the demand for deployment of blockchain in the region from the past few years. Walmart is among the organizations that have adopted blockchain technology in the region. The increasing demand for blockchain in the Retail sector for tracking and monitoring is propelling the segment growth over the thepast few years. 2019 2025F Manufacturing Government & Transportation Logistics Healthcare & Lifescience • The emergence of 5G in the region is surging the demand for XXXX and XXXX consequently, XXX companies start facing problems in managing maintaining market place security, etc. To solve such problems, the demand for blockchain is anticipated to rise among e-commerce organizations over the next 5 years. This expected to rise the segment growthduring2020-25. increasing penetration of the internet and Energy & Utilities Media & Entertainment BFSI IT & Telecom the supply chain, data transparency and Retail & E-commerce Others (Agriculture, etc.) Source: MarkNtel Advisors *These are dummy charts and do not represent actual value 42 Copyright 2020. Reproduction is forbidden unless authorized. All rights reserved.
+1 (613) 707-5086 sales@marknteladvisors.com 43 Copyright 2020. Reproduction is forbidden unless authorized. All rights reserved.