Download
1 / 18
180 likes | 318 Views
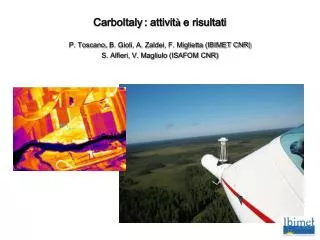
CarboItaly : attivit à e risultati P. Toscano , B. Gioli, A. Zaldei, F. Miglietta (IBIMET CNR) S. Alfieri, V. Magliulo (ISAFOM CNR). Dataset dei dati meteo da stazioni meteorologiche delle reti nazionali e dati rianalisi Downscaling dati climatici ad alta risoluzione per aree test.

E N D
CarboItaly: attività e risultati P. Toscano,B. Gioli, A. Zaldei, F. Miglietta (IBIMET CNR) S. Alfieri, V. Magliulo (ISAFOM CNR)
Dataset dei dati meteo da stazioni meteorologiche delle reti nazionali e dati rianalisi • Downscaling dati climatici ad alta risoluzione per aree test • Radiazione incidente MSG (DSSF) Data 30 min Daily data • Precipitazione MSG (MPE) Data 15 min Daily data • Temperatura superficiale MSG (LST) Data 15 min Daily data
Validazione VS LeBray (Rad globale) Validazione VS LeBray (Rad Netta, con Albedo MSG)
Data-assimilation satellite / stazioni meteo (LST) Land Surface temperature (Ta) Air temperature Approach Use data assimilation schemes by integrating weather stations
SPOT Vegetation - 1 km x 10 days resolution - Full coverage 2006 / 2007 • Single Spectral Band (0.43 - 0.47 µm, 0.61 - 0.68 µm, 0.78 - 0.89 µm, 1.58 - 1.75 µm) • NDVI
Misure a scala regionale Track suddivisa in 4 porzioni autonome, delimitate da ecosistemi differenti o da zone ad orografia complessa. 3 Intensive Operation Periods (IOP) • Tipicamente 4/5 giorni di attività di rilievo per IOP • 1 - 4 voli/giorno sull’area di studio in diverse condizioni ambientali • Due velivoli (IBIMET ed ISAFOM) alternati nell’area di studio • fCO2, H, LE misurati su ‘pixel’ di ca. 4 km
1 0 Rappresentatività spaziale delle misure fAPAR distribution (fAPAR = Fraction of absorbed photosynthetically active radiation Observations Total area
Agr For Grass -NEE = GPP - Reco GPP = Gross Primary Productivity NEE = Net Ecosystem Exchange Reco = Ecosystem respiration Variabilità spaziale e temporale della fotosintesi (media giornaliera)
Risposta della fotosintesi (media giornaliera) alle caratteristiche spettrali della vegetazione (fAPAR) ed a driver ambientali (radiazione PAR e temperatura superficiale) fAPAR = fraction of absorbed PAR radiation ( MODIS) PAR = Photosynthetic Active Radiation ( observations) LST = Land Surface Temperature ( Meteosat)
Light Use Efficiency concept (Monteith, 1977) GPP = (fAPAR * PAR) * LUE GPP = Gross Primary Productivity [observed] LUE = Light Use Efficiency [?] fAPAR = fraction of absorved PAR by vegetation [MODIS] PAR = incoming PAR radiation [observed, MSG satellite] APAR = total abosorbed PAR LUE = GPP / (fAPAR * PAR) = GPP / APAR
Variabilità spaziale e temporale di Light Use Efficiency (LUE) LUE = GPP / (fAPAR * PAR)
Risposta di Light Use Efficiency (LUE) a driver ambientali (VPD, T, LST) Tipicamente VPD e T sono impiegati come fattori limitanti per LUE (es. prodotto MOD17)
Risposta di Light Use Efficiency a Land Surface Temperature (LST) antecedente LST_DT = LST integrata su un periodo precedente (20-40gg); effetto di isteresi nella risposta dell'ecosistema
Overall results of GPP predictions GPP = LUE * fAPAR * PAR LST (MSG satellite) MODIS satellite MSG satellite
Applicazione del forcing satellitare (MODIS + MSG) all’area di studio GPP = - NEE + Reco GPP, NEE, Reco = F ( fAPAR , PAR , LST , LC ) MODIS 16-day @ 1km Corine MSG 30 min @ 5km MSG 15 min @ 5km PAR è stimata dal prodotto MSG DSSF (Downwelling Shortwave Radiation)
Temp Temp PAR PAR GPP GPP Reco Reco Flussi orari sull’area di studio nei 3 IOPs Esempio: May 27, 2007 at 11 UTC (IOP1) Esempio: May 27, 2007 at 22 UTC (IOP1)