Interest Rate Determination
Explore changes in interest rates through an example scenario, budget lines, shifts, and effects on spending today and in the future. Understand how economic models apply.

Interest Rate Determination
E N D
Presentation Transcript
Interest Rate Determination Here we start with an example and end with a theory of changes in the interest rate.
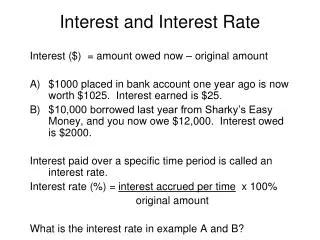
Suppose you have $1000 today and expect to receive another $1000 one year from today. Your savings account pays an annual interest rate of 25%, and your bank is willing to lend you money at that same interest rate. Let’s call c2 the amount you spend next year and c1 the amount spend today. Let’s also call the endowment values today and next year E1 and E2, respectively. r is the interest rate. The budget line then has for c2 = E2 + E1(1+r) – c1(1+r). a. Suppose that you save all of your money to spend next year. How much will you be able to spend next year? This is the same as asking on the budget what is c2 when c1 = 0? c2 would be 1000 + 1000(1.25) = 2250. How much will you be able to spend today is like what is c1 if c2 = 0. c1 would be (1000/1.25) + 1000 = 1800.
b. Suppose you borrow $800 and spend $1800 today. How much will you be able to spend next year? If c1 = 1800, c2 = 1000 + 1000(1.25) – 1800(1.25) = 0. c. The graph is on the next slide with c1 on the horizontal and c2 on the vertical axis. Note the vertical intercept is (0, 2250), the horizontal intercept is (1800, 0) and the endowment point is (1000, 1000) The slope = (2250-0)/(0-1800) = -1.25, so the slope shows that the price of spending $1 today means you can not spend $1.25 next year. Note if c1= E1, then c2 = E2, and vice versa. This means the person can have their endowment point and neither borrow or lend.
c2 (0, 2250) (1000, 1000) (1800, 0) c1
Say you find $400 in your desk drawer. Your endowment today becomes 1400. How does the budget shift? Note the new intercepts and endowment point. c2 (0, 2750) (0, 2250) (1400, 1000) (1000, 1000) (2200, 0) (1800, 0) c1
Say you will get $500 more in pay next year. Your endowment next year becomes 1500. How does the budget shift? Note the new intercepts and endowment point. The budget shifts just like in the previous example. c2 (0, 2750) (0, 2250) (1000, 1500) (1400, 1000) (1000, 1000) (2200, 0) (1800, 0) c1
If the interest rate rises to 50% the budget rotates clockwise through the budget. Note the new intercepts. c2 (0, 2500) (0, 2250) (1000, 1000) (1666.67, 0) (1800, 0) c1
E. If you found the $400 today, or get a rise of $500 next year, either way your budget ends up the same so you would consume the same amount today and next year in either scenario. f. On the next slide you see what it looks like at the original endowment of 1000 in each period and r=.25 when the person neither borrows nor lends. g. Two slides from here you see what happens when the interest rate rise to 50%. Current spending is decreased, future spending is increased and the person is better off. Remember the person started at the endowment point here. The result may not hold for all types of starting points (like if the person started out a borrower.)
Here the endowment point yields the most utility for the individual. c2 (0, 2250) (1000, 1000) (1800, 0) c1
If the interest rate rises to 50% the budget rotates clockwise through the budget. The individual can now get to a higher indifference curve. The person will make c1 lower and c2 higher and be happier. c2 (0, 2500) (0, 2250) (1000, 1000) (1666.67, 0) (1800, 0) c1
h. To show the income and substitution effects you take the new budget and shift it parallel so it is tangent to the original indifference curve. Here the real movement is from A to C. But A to B is the sub. Effect. C1 falls and c2 rises. From B to C is the income effect. C1 rises and c2 could rise or fall, here it looks like it rises. Remember here when r rises c1 falls and c2 rises in total. c2 (0, 2500) (0, 2250) C B A (1000, 1000) (1666.67, 0) (1800, 0) c1
Our next task is to use the framework presented so far, but in a national economy sense to show under some conditions how the interest rate can change. The model is really one of a closed economy. In the national economy closed to the rest of the world economy c1 and c2 refer to production today and production next year. We can only consume what we can produce. Now, since in the economy every dollar borrowed is also every dollar lent, the average or representative consumer is neither a borrower or lender. In other words the endowment point would be the optimal point. This point is shown in the graph on the next slide. Remember that the interest rate is built into the slope of the budget line. So we have an interest rate implicit in the graph.
Say we expect the future to get brighter, meaning we expect to make more in the future than what we used to expect. The budget shifts up and the endowment point moves up the straight line shown. Since the representative consumer has to be at the endowment we have to end up at this point. But in the graph you see that even the representative consumer has the urge to borrow. So, if there is a relatively strong demand to borrow for current consumption the interest rate will rise to chock off the excess demand for borrowing. We see the final point on the next slide.
As the new budget rotates with a higher interest rate we get a tangency with the new indifference curve.
Now let’s consider a case where the present gets bright, meaning we can produce more today than we thought we could. The budget line will shift right. We see how on the next slide.
The budget shifts right and the endowment point moves over on the straight line shown. Since the representative consumer has to be at the endowment we have to end up at this point. But in the graph you see that even the representative consumer has the urge to lend. So, if there is a relatively strong desire to lend for more consumption next year the interest rate will fall to stop the urge to lend. We see the final point on the next slide.