Download
1 / 25
250 likes | 424 Views
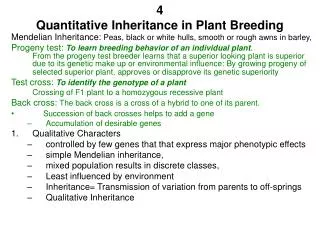
4 Quantitative Inheritance in Plant Breeding. Mendelian Inheritance: Peas, black or white hulls, smooth or rough awns in barley,

E N D
4 Quantitative Inheritance in Plant Breeding Mendelian Inheritance: Peas, black or white hulls, smooth or rough awns in barley, Progeny test: To learn breeding behavior of an individual plant. From the progeny test breeder learns that a superior looking plant is superior due to its genetic make up or environmental influence: By growing progeny of selected superior plant, approves or disapprove its genetic superiority Test cross: To identify the genotype of a plant Crossing of F1 plant to a homozygous recessive plant Back cross: The back cross is a cross of a hybrid to one of its parent. • Succession of back crosses helps to add a gene • Accumulation of desirable genes • Qualitative Characters • controlled by few genes that that express major phenotypic effects • simple Mendelian inheritance, • mixed population results in discrete classes, • Least influenced by environment • Inheritance= Transmission of variation from parents to off-springs • Qualitative Inheritance
Quantitative Traits • Quantitative characters: • inheritance controlled by several to many genes (Poly genes) at different loci, that express major phenotypic effects, • Inheritance unlike simple Mendelian traits • Segregating population result in continuous classes • expression under strong influence of environment • Quantitative Inheritance, is concerned with inheritance of multigenic traits. • Example, Yield of a plant, • sample from a genetically mixed population will not be in discrete classes i.e. high and low rather it would be in curve ranging from low to high, • Yield will be affected by • Genetic component • Environmental component • Genotype X environment interaction G X E
Transgressive Segregation • Plants with traits that arise by segregation of genes for a quantitative character that fall outside the range of of the parents are known as Transgressive Segregates. • Very Dark red (R1R1R2R2) and white (r1r1r2r2) grain color in wheat results in Very dark red, Dark red(1 recessive gene), Medium red (2 recessive genes), light red (3 recessive genes) and white (4 recessive genes) in 1:4:6:4:1, when medium red is crossed with medium red, F1 is Medium red whereas F2 segregates to produce Very dark red and white segregates, both beyond the range of parents. • Similar observations are made in quantitative traits i.e. yield.
Gene Interaction • Complementary: Two non-allelic genes are required to produce a single effect. In oats AB= resistant to crown rust, Ab,aB,ab = susceptible • Modifying: One gene produces an effect only in the presence of a second gene at another locus. In corn • Inhibiting: One gene may act as an inhibitor of the expression of other • Masking: One gene may hide the effect of a second gene when both are present. • Duplicate: Either of two genes may produce a similar effect or same effect is produced by both of them together. • Additive: Two genes may produce the same effect, but the effects are additive if both genes are present • Pleiotropic: A single gene may have more than one effect. In barleyUz=normal in appearance, uz = semi-dwarf, short awns, small seeds, short erect flag leaf, dense spike
Characteristics of Multiple Gene Inheritance • Multiple genes or Poly genes are genes at different loci that affect the expression of same phenotypic character. • Quantitative Trait Loci (QTL): The location of these genes on the chromosome controlling quantitative traits is termed as QTL. • Genes follow the same principles of inheritance in quantitative and qualitative, differences are due to number and expression • Each multiple gene has a small effect on the phenotype relative to the total variation, normally, it is not possible to identify individual gene effect • Many genes at various loci (QTLs) contribute to the expression of a quantitative character. Distinct segregation ratios are not observed. • Individual effects of the gene are cumulative, the net effect enabling measurement of phenotypic values. In a random mating population, phenotypic values will exhibit continuous variation. • Phenotypic values of a quantitative trait include both genetic and environmental component and G X E interaction. • Effects of multiple genes are expressed through different types of gene action: additive, dominant, over-dominant and epistasis. • Transgressive segregates may arise due to multiple genes resulting in superior genotypes than parents
Quantitative Inheritance and its measurement • Quantitative character can not be classified into distinct classes • Classification is dependent on measurement of character taken from a large number of random plants (the sample should be large enough to represent the range of variability present in the population) • These numerical values form a continuous series and are studies through various statistical parameters • These parameters include range, mean, variance, standard deviation and coefficient of variation • Of these mean and variance are most important • RANGE: is the distance on the scale of measurement from the lowest to highest observed value • MEAN: is an arithmetic average of of the sample measurement for the character being studied • VARIANCE: The dispersion of the observations in the population is designated by the variance. • The variance is used to calculate standard deviation (SQRT Var) in making heretability estimates or break down into its components in an analysis of variance.
Measurement of Continuous Variation • In case of normal distribution when variance and standard deviation are normal, it is supposed that + 1 sd from the mean will include 68.26 of the observations, whereas + 2 sd from mean will include 95.45% of the observations. • A small variance and small sd will result in clustering of observations around mean • Whereas large variance and large sd will show widely spread observations around mean. • For making comparison of variability of data groups with quite different means, the CV may be used • CV = (s/X’) *100 where s=standard deviation, x’ = mean • CV of 10% or less ids generally desired • The difference in case of heterogeneous population (open pollinated corn) may be due to genotype, environment and GXE • The differences in case of homogeneous or uniform population (Wheat) may be due to G X E
Frequency distribution of sample data set with calculations of descriptive values
Number of Genes Contributing to a Quantitative Character n = (Xp1-Xp2)2/{8[sdF2)2 – (sdF1)2]} Where n = number of genes Xp1= mean of one parent Xp2= mean of 2nd parent sdF1= standard deviation of F1 generation sdF2= standard deviation of F2 generation Assumptions • Genes have equal effect • No epistasis, no dominance, no linkage • Due to absence of these assumptions, estimated number may be quite lower than actual • Method is not reliable when more than 4 or 5 genes are involved
Multiple Alleles Allele: • Alternate forms of a gene present at one locus (location) on a chromosome are termed as allele. E.g. Gene for height in peas, It may be tall (TT) or dwarf (tt). • An individual may be homozygous (TT, tt) or heterozygous (Tt). Multiple Alleles: • As quantitative characters are controlled by several genes so a locus may have more than two alleles. So more than one pair of alleles that occupy the same locus is termed as Multiple allele. • With 2 alleles at a locus (A1,A2), three combinations are possible (A1A1, A1A2, A2A2), with three alleles(A1,A2,A3), six combinations are possible (A1A1, A1A2,A1A3, A2A2, A2A3, A3A3) and with 4 alleles, 10 combinations are possible. • Number of combinations = n(n+1)/2 where n= no. of alleles • In quantitative characters, multiple alleles may be present at more than one loci, depicting the huge no. of possible combinations
Frequency distribution of sample data set with calculations of descriptive values
Types of Gene Action Four Types of gene action are recognized • ADDITIVE Effects: Action of each gene enhances expression of the trait. e.g. if the affect of one gene adds one unit, the two genes will increment 2 units etc. if aabb=0, Aabb=1, AaBb=2, AABb=3 and AABB=4 • DOMINANCE Effects: Heterozygote is more like dominant parent. With complete dominance,the heterozygote and one homozygote have equal effect. e.g. aa=0, Aa=2, AA=2. • EPISTATIC Effects: are the results of non-allelic interactions i.e. genes present at different loci. Two genes may have no effect individually, yet have an effect when combined. AAbb=0, aaBB=0, A_B_ =4 • OVERDOMINANCE Effects: occur when each allele contribute an effect greater than that of either allele separately i.e. non-additivity exists. If the effect of each allele is one, aa=1, AA=1, Aa=3 • Additive = Selection of superior individual is efficient • Dominance & Epistasis = Selection of superior individual is less efficient • Over dominace can be fixed in F1 hybrid through Apomixes or wide crossing following chromosome doubling
Scenario A. DominanceFewer genes are under-expressed in the homozygous individual. Gene expression in the offspring is equal to the expression of the fittest parent. AA Aa aa A X Aa AA B aa X Scenario B Overdominance Over-expression of certain genes in the heterozygous offspring. (The size of the circle depicts the expression level of gene A)
Heritability • Plants from a mixed population may differ due to • Genetic differences • Environment • G X E interaction • Selection from such population will depend upon • Extent of variability due to genetic component and its expected transmission to progeny • Extent of variability due to environment • Heritability • The proportion of the observed variation in the progeny that is inherited • If the genetic component is high than the environmental component, then heritability will be high AND • If the genetic component is lower than the environmental component, then heritability will be low. WHY ESTIMATES OF HERITABILTY? • For plant improvement, Selection of better individual is required • For efficient selection, the performance should remain stable in progeny • AND Selection will be more effective when genetic component is higher than environmental component i.e. high heritability
Heritability Estimates Variance (V) calculated from observed variation in the quantitative character is phenotypic variance (Pv). Vp = Vg + Ve + Vge Vg = Va+ Vd + Vi Va = Additive genetic variance Vd = Dominance variance Vi = non-allelic or epistasis variance
Types of Heritability Estimates • Heritability is the proportion of the phenotypic variance that is due to genetic cause • H = Vg/Vp • H = Vg/ (Vg + Ve + Vge) • H = (Vg/Vp) x 100 • Heritability estimates made on the basis of all genetic effects is termed as broad sense heritability • h2 = (Va/Vp) x 100 • Heritability estimates made as percentage of additive variance are termed as narrow sense heritability • Heritability narrow sense can never exceed broad sense heritability
Heritability from F2 Population • P1, P2, F1, F2 • H(bs) = Vg/ Vp • H(bs) = Vp-Ve/ Vp • Ve = (Vp1+Vp2+VF1)/3
Heritability from variance Components • H = 2g/ ( 2gy+ 2gl+ 2gyl+ 2ge+ 2g) • 2g = Total genetic variance • 2gy = genotype X year variance • 2gl = genotype x location variance • 2gyl = genotype x year x location variance • 2ge = genotype x environment variance
Heritability and Selection • Characters under environment influence have low heritability estimates as compared to characters under low environment influence. • Selection in F2 will be less effective for the traits with low heritability and Selection will be more effective for the traits with high heritability • The principal uses of heritability estimates are: • To determine the relative importance of genetic effects which could be transferred from parents to off-spring • To determine which selection method would be most useful to improve the trait and • To predict gain from selection (genetic advance)
Heritability from Parent – offspring regression Basic assumptions for use of Parent- progeny regression • Traits has diploid Mendelian inheritance • No linkage • Parents are non-inbred • The population from which parents were extracted is in random mating equilibrium • No environmental relationship between the performance of parents and offspring b = Σ (x – x) * ( y – y) / Σ (x – x)2 Where x = parent values, y = progeny values, b = regression of y on x • Regression of progeny performance on parent performance is based on resemblance between relative and measured additive variance • This narrow sense heritability is calculated as h2 = b x 100 In case of open pollinated crop h2 = 2b x 100
Selection intensity and Genetic Advance • Superior plants in the population may be superior due to genetic potential, favorable environment or both (G X E) • e.g. If high yield is the breeding objective, can it be achieved by 5% selection pressure or by keeping 10% of the population • Expected gentic gain with one cycle of selection can be predicted Gs = (i) (SQRT Vp) * h2 Where Gs = genetic advance, SQRT Vp = square root of phenotypic variance (sd) h2 = narrow sense heritability of the trait under study, i = selection Intensity • Heritability (ns) estimates are used in sexually reproducing plants • Heritability (bs) estimates are used in Asexually reproducing plants SELECTION INTENSITY IF h2 = 0.67 or 67% i (5%) = 2.063, Vp = 0.171 THEN Gs = 2.063 * SQRT 0.171 * 0.67 = 0.57 if the mean of trait in the unselected population is 4.5 THEN Gain expressed after one cycle of selection will be = (0.57/4.5)*100 = 12.6% SHIFT IN MEAN DUE TO SELECTION
Gene Frequency and Genetic Equilibrium GENE FREQUENCY : refers to the proportions of the different alleles in a gene pool of a breeding population. GENOTYPE FREQUENCY : refers to the proportions of various alleles in a population. IF we consider a population of 100 diploid individuals with 2 alleles (A1 A2) at one locus There are three genotypic classes with X (A1A1) 36 individuals, Y (A1A2) 48 individuals and Z (A2A2) 16 individuals The genotype frequencies will be X (A1A1) = 36/100 = 0.36 Y (A1A2) = 48/100 = 0.48 Z (A2A2) = 16/100 = 0.16 Allele frequencies will be A1 = (2*36) + 48 = 120/ 200 = 0.60 A2 = (2*16) + 48 = 80/ 200 = 0.40
Gene Frequency and Genetic Equilibrium HARDY-WEINBERG LAW: The probability of two alleles mating is the product of the frequency of the alleles in the population. If the gene frequencies of two alleles among the parents are p & q and p+q=1 THEN genotype frequency = p2 +2pq + q2 IF we put the values of A1 & A2 THEN Genotypic frequency of A1A1 = A12 = 0.6*0.6 = 0.36 A1A2 = 2A1A2 = 2(0.6*0.4) = 0.48 A2A2 = A22 = 0.4*0.4 = 0.16 This population is not in genetic equilibrium But may reach genetic equilibrium after one generation of random mating, which is a general rule for any single, independently segregating locus.
IMPLICATIONS OF HARDY-WEINBERG LAW FOR PLANT BREEDERS Following propositions should be kept in mind while using Hardy-Weinberg law in plant breeding • Random mating does not occur in natural populations of self pollinated crops. Gene frequency will remain same but genotype frequency will change • Random mating will occur in only cross pollinated species • Selection for a particular allele may change the frequency of that allele in population and consequently its genotypic frequency • Selection for a dominant allele will not eliminate recessive genes from the population but selection for recessive gene may eliminate the dominant gene from population