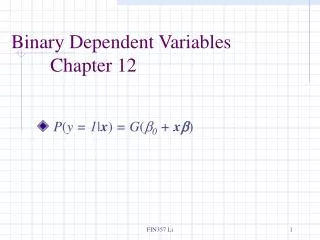
9. Binary Dependent Variables
9. Binary Dependent Variables. 9.1 Homogeneous models Logit, probit models Inference Tax preparers 9.2 Random effects models 9.3 Fixed effects models 9.4 Marginal models and GEE Appendix 9A - Likelihood calculations. 9.1 Homogeneous models.

9. Binary Dependent Variables
E N D
Presentation Transcript
9. Binary Dependent Variables • 9.1 Homogeneous models • Logit, probit models • Inference • Tax preparers • 9.2 Random effects models • 9.3 Fixed effects models • 9.4 Marginal models and GEE • Appendix 9A - Likelihood calculations
9.1 Homogeneous models • The response of interest, yit, now may be only a 0 or a 1, a binary dependent variable. • Typically indicates whether the ith subject possesses an attribute at time t. • Suppose that the probability that the response equals 1 is denoted by Prob(yit = 1) = pit. • Then, we may interpret the mean response to be the probability that the response equals 1 , that is, E yit= 0 Prob(yit = 0) + 1 Prob(yit = 1) = pit . • Further, straightforward calculations show that the variance is related to the mean through the expression Var yit= pit (1 - pit) .
Inadequacy of linear models • Homogeneous means that we will not incorporate subject-specific terms that account for heterogeneity. • Linear models of the form yit = xit + it are inadequate because: • The expected response is a probability and thus must vary between 0 and 1 although the linear combination, xit, may vary between negative and positive infinity. • Linear models assume homoscedasticity (constant variance) yet the variance of the response depends on the mean which varies over observations. • The response must be either a 0 or 1 although the distribution of the error term is typically regarded as continuous.
Using nonlinear functions of explanatory variables • In lieu of linear, or additive, functions, we express the probability of the response being 1 as a nonlinear function of explanatory variables pit = (xit). • Two special cases are: • the logit case • (z ) as a cumulative standard normal distribution function, the probit case. • These two functions are similar. I focus on the logit case because it permits closed-form expressions unlike the cumulative normal distribution function.
Threshold interpretation • Suppose that there exists an underlying linear model, yit* = xit + it*. • The response is interpreted to be the “propensity” to possess a characteristic. • We do not observe the propensity but we do observe when the propensity crosses a threshold, say 0. • We observe • Using the logit distribution function, Prob (it*a) = 1/ (1 + exp(-a) ) • Note that Prob(-it*xit) = Prob(it*xit). Thus,
Random utility interpretation • In economics applications, we think of an individual choosing among c categories. • Preferences among categories are indexed by an unobserved utility function. • We model utility as a function of an underlying value plus random noise, that is, Uitj = uit(Vitj + eitj), j = 0,1. • If Uit1 > Uit0 , then denote this choice as yit = 1. • Assuming that uit is a strictly increasing function, we have • Parameterize the problem by taking Vit0 = 0 and Vit1 = xit β. • We may take the difference in the errors, it0 - it1 , to be normal or logistic, corresponding to the probit and logit cases.
Logistic regression • This is another phrase used to describe the logit case. • Using p = (z), the inverse of can be calculated as z = -1(p) = ln ( p/(1-p) ) . • Define logit (p) = ln ( p/(1-p) ) to be the logit function. • Here, p/(1-p) is known as the odds ratio. It has a convenient economic interpretation in terms of fair games. • That is, suppose that p = 0.25. Then, the odds ratio is 0.333. • The odds against winning are 0.333 to 1, or 1 to 3. If we bet $1, then in a fair game we should win $3. • The logistic regression models the linear combination of explanatory variables as the logarithm of the odds ratio, xit = ln ( pit/(1-pit) ) .
Parameter interpretation • To interpret =( 1, 2, …, K), we begin by assuming that jth explanatory variable, xitj, is either 0 or 1. • Then, with the notation, we may interpret • Thus, • To illustrate, if j = 0.693, then exp(j) = 2. • The odds (for y = 1) are twice as great for xj = 1 as for xj = 0.
More parameter interpretation • Similarly, assuming that jth explanatory variable is continuous, we have • Thus, we may interpret j as the proportional change in the odds ratio, known as an elasticity in economics.
Parameter estimation • The customary estimation method is maximum likelihood. • The log likelihood of a single observation is • The log likelihood of the data set is • Taking partial derivatives with respect to b yields the score equations • The solution of these equations, say bMLE, yields the maximum likelihood estimate. • The score equations can also be expressed as a generalized estimating equation: • where
For the logit function • The normal equations are: • The solution depends on the responses yit only through the vector of statistics itxityit . • The solution of these equations, say bMLE, yields the maximum likelihood estimate bMLE . • This method can be extended to provide standard errors for the estimates.
9.2 Random effects models • We accommodate heterogeneity by incorporating subject-specific variables of the form: pit = (i + xit ). • We assume that the intercepts are realizations of random variables from a common distribution. • We estimate the parameters of the {i} distribution and the K slope parameters . • By using the random effects specification, we dramatically reduced the number of parameters to be estimated compared to the Section 9.3 fixed effects set-up. • This is similar to the linear model case. • This model is computationally difficult to evaluate.
Commonly used distributions • We assume that subject-specific effects are independent and come from a common distribution. • It is customary to assume that the subject-specific effects are normally distributed. • We assume, conditional on subject-specific effects, that the responses are independent. Thus, there is no serial correlation. • There are two commonly used specifications of the conditional distributions in the random effects panel data model. • 1. A logistic model for the conditional distribution of a response. That is, • 2. A normal model for the conditional distribution of a response. That is, • where is the standard normal distribution function.
Likelihood • Let Prob(yit = 1| i) =(i + xit) denote the conditional probability for both the logistic and normal models. • Conditional on i, the likelihood for the it thobservation is: • Conditional on i, the likelihood for the ith subject is: • Thus, the (unconditional) likelihood for the ith subject is: • Here, is the standard normal density function. • Hence, the total log-likelihood is i ln li . • Note: lots of evaluations of a numerical integral….
Comparing logit to probit specification • There are no important advantages or disadvantages when choosing the conditional probability to be: • logit function (logit model) • standard normal (probit model) • The likelihood involves roughly the same amount of work to evaluate and maximize, although the logit function is slightly easier to evaluate than the standard normal distribution function. • The probit model is slightly easier to interpret because unconditional probabilities can be expressed in terms of the standard normal distribution function. • That is,
9.3 Fixed effects models • As with homogeneous models, we express the probability of the response being 1 as a nonlinear function of linear combinations of explanatory variables. • To accommodate heterogeneity, we incorporate subject-specific variables of the form: pit = (i + xit). • Here, the subject-specific effects account only for the intercepts and do not include other variables. • We assume that {i} are fixed effects in this section. • In this chapter, we assume that responses are serially uncorrelated. • Important point: Panel data with dummy variables provide inconsistent parameter estimates….
Maximum likelihood estimation • Unlike random effect models, maximum likelihood estimators are inconsistent in fixed effects models. • The log likelihood of the data set is • This log likelihood can still be maximized to yield maximum likelihood estimators. • However, as the subject size n tends to infinity, the number of parameters also tends to infinity. • Intuitively, our ability to estimate is corrupted by our inability to estimate consistently the subject-specific effects {i} . • In the linear case, we had that the maximum likelihood estimates are equivalent to the least squares estimates. • The least squares estimates of were consistent. • The least squares procedure “swept out” intercept estimators when producing estimates of .
Maximum likelihood estimation is inconsistent • Example 9.2 (Chamberlain, 1978, Hsiao 1986). • Let Ti = 2, K=1 and xi1 = 0 and xi2=1. • Take derivatives of the likelihood function to get the score functions – these are in display (9.8). • From (9.8), the score functions are • and • Appendix 9A.1 • Maximize this to get bmle • Show that the probability limit of bmle is 2 , and hence is an inconsistent estimator of .
Conditional maximum likelihood estimation • This estimation technique provides consistent estimates of the beta coefficients. • It is due to Chamberlain (1980) in the context of fixed effects panel data models. • Let’s consider the logit specification of , so that • Big idea: With this specification, it turns out that tyitis a sufficient statistic for i. • Thus, if we condition on tyit, then the distribution of the responses will not depend on i.
Example of the sufficiency • To illustrate how to separate the intercept from the slope effects, consider the case Ti = 2. • Suppose that the sum, tyit = yi1+yi2, equals either 0 or 2. • If sum equals 0, then Prob (yi1 = 0, yi2 = 0 |yi1 + yi2 = sum) = 1. • If sum equals 2, then Prob (yi1 = 1, yi2 = 1 |yi1 + yi2 = sum) = 1. • Both conditional probabilities do not depend on i . • Both conditional events are certain and will contribute nothing to a conditional likelihood. • If sum equals 1,
Example of the sufficiency • Thus, • This does not depend on i. • Note that if an explanatory variable xij is time-constant (xij2 xij1 ), then the corresponding parameter j disappears from the conditional likelihood.
Conditional likelihood estimation • Let Sibe the random variable representing tyit and let sumi be the realization of t yit . • The conditional likelihood of the data set is • Note that the ratio equals one when sumi equal 0 or Ti. • The distribution of Si is messy and is difficult to compute for moderate size data sets with T more than 10. • This provides a fix for the problem of “infinitely many nuisance parameters.” • Computationally difficult, hard to extend to more complex models, hard to explain to consumers
9.4 Marginal models and GEE • Marginal models, also know as “population-averaged” models, only require specification of the first two moments • Means, variances and covariances • Not a true probability model • Ideal for moment estimation (GEE, GMM) • Begin in the context of the random effects binary dependent variable model • The mean is E yit = • The variance is Var yit = mit (1- mit ). • The covariance is Cov (yir, yis)
GEE – generalized estimating equations • This is a method of moments procedure • Essentially the same as generalized method of moments • One matches theoretical moments to sample moments, with appropriate weighting. • Idea – find the values of the parameters that satisfy • We have already specified the variance matrix. • We also use a K x Ti matrix of derivatives • For binary variables, we have
Marginal Model • Choose the mean function to be • Motivated by probit specification • For the variance function, consider Var yit = it (1- it). • Let Corr(yir, yis) denote the correlation between yir and yis. • This is known as a working correlation. • Use the exchangeable correlation structure specified as • Here, the motivation is that the latent variable i is common to all observations within a subject, thus inducing a common correlation. • The parameters τ = (, ) constitute the variance components.
Robust Standard Errors • Model-based standard errors are taken from the square root of the diagonal elements of • As an alternative, robust or empirical standards errors are from • These are robust to misspecified heterscedasticity as well as time series correlation.