Download
1 / 72
720 likes | 873 Views
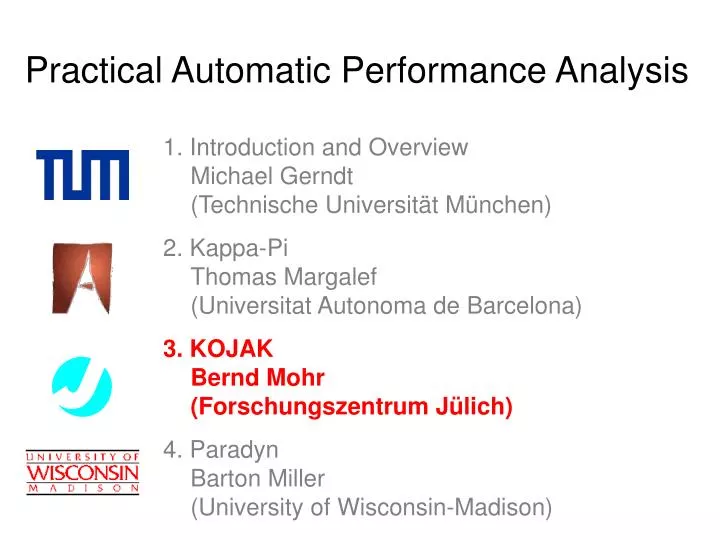
Outline. The KOJAK Project An Overview and Introduction Semi-automatic Preparation Instrumentation of - User Functions and Regions - MPI Calls - OpenMP constructs Automatic Analysis EARL and its Abstractions Performance Properties EXPERT Analyzer and Presenter. Color Coding

E N D
Outline • The KOJAK Project • An Overview and Introduction • Semi-automatic Preparation • Instrumentation of - User Functions and Regions - MPI Calls - OpenMP constructs • Automatic Analysis • EARL and its Abstractions • Performance Properties • EXPERT Analyzer and Presenter
Color Coding Shows the severityof the problem Class of Behavior Which kind ofbehavior causedthe problem? Call Graph Where in the sourcecode is the problem?In which context? Location How is the problemdistributed acrossthe machine?
The KOJAK Project Bernd Mohr b.mohr@fz-juelich.de Felix Wolf f.wolf@fz-juelich.de Forschungszentrum Jülich (FZJ) John von Neumann - Institut für Computing (NIC) Zentralinstitut für Angewandte Mathematik (ZAM) 52425 Jülich, Germany http://www.fz-juelich.de/zam/kojak/
KOJAK Overview • Kit for Objective Judgement and AutomaticKnowledge-based detection of bottlenecks • Long-term goal:Design and Implementation of a • Portable • Generic • Automatic Performance Analysis Environment • Current Focus • Event Tracing • Clusters of SMP • MPI, OpenMP, Hybrid (OpenMP + MPI) Programming Model
Why Event Tracing? • Reasons • Event traces preserve the • Temporal • Spatial relationships among individual events • Allows reconstruction of dynamic behavior of application on any required abstraction level • Necessary to prove interesting performance properties • Profiling information can be calculated out of event trace(but not vice versa) • Disadvantages • Can produce (potentially too) large trace files • Requires sophisticated instrumentation
Interconnection Network memory memory Clusters of SMP • Hierarchical architecture • Shared memory within SMP node • Distributed memory among nodes • Programming models: MPI, OpenMP, Hybrid • Other architectures are special cases: MPP, SMP, Sequential • Problems: - complex performance behavior - lack of appropriate tools Machine SMP Node SMP Node SMP Node node memory …
Semi-automaticPreparation executable run AutomaticAnalysis trace files KOJAK: Current Architecture user program
Outline • The KOJAK Project • An Overview and Introduction • Semi-automatic Preparation • Instrumentation of - User Functions and Regions - MPI Calls - OpenMP constructs • Automatic Analysis • EARL and its Abstractions • Performance Properties • EXPERT Analyzer and Presenter
OPARI instrumented program Compiler / Linker POMP+PMPI libraries run EPILOG library AutomaticAnalysis trace files Semi-automatic Preparation: Current Process Semi-automatic Preparation user program executable
Event Tracing • Event Processing, Investigation, and LOGging (EPILOG) • Open (public) event trace format andAPI for reading/writing trace records • Event Types • Region enter and exit • Collective region enter and exit • Message send and receive • Parallel region fork and join • Lock aquire and release • Supports • Hierarchical cluster hardware • Source code information • Performance counter values • Thread-safe implementation
Machine Interconnection Network SMP Node SMP Node SMP Node memory node memory memory VM space … … Processes Threads EPILOG: Event Location • Event location is tuple: (machine, node, process, thread)
Instrumentation • Instrument user application with EPILOG calls • Done: basic instrumentation • User functions and regions: • Compiler (and manual) instrumentation • MPI calls: • Library instrumentation • OpenMP: • Source-to-source instrumentation • Future work: • Tools for Fortran, C, C++ user function instrumentation • Object code and dynamic instrumentation
Instrumentation of User Functions / Regions • Done: Undocumented, unsupported User Function Instrumentation by PGI Compilers (pgf77, pgf90, pgcc, pgCC) • Work in Progress: Generic / Portable Instrumentor • Joint Work with Allen Malony / Sameer Shende (PDTOOLKIT) http://www.acl.lanl.gov/pdtoolkit • Based on commercial parsers • C, C++: Edison Design Group (EDG) • Full ISO 1998 C++ Support • Full(?) ISO 1999 C Support • Fortran 77, Fortran90: Mutek • Prog. Database Util. and Conv. Tools APpl. Env. (DUCTAPE) • Object-oriented Access to Static Information • (Classes, Modules, Routines, Types, Files, Macros, Namespaces, Templates)
Instrumentation of MPI Calls • Wrapper Library utilizingStandard MPI Profiling Interface (PMPI) • Done: Support for MPI 1.2 • Point-to-Point Communication • Collective Communication • Testsuite • MPI Behavior (“does it still work?”) • Wrapper Correctness (“does it record the right data?”) • Missing: Support for MPI 2.0 • One-sided Communication • Parallel I/O • Dynamic Task Creation
Profiling Library MPI Library MPI Library MPI_Send MPI_Send MPI_Send PMPI_Send PMPI_Send MPI_Bcast MPI_Bcast PMPI: The Standard MPI Profiling Interface • PMPI allows selective replacement of MPI routines at link time no re-compilation necessary • Used by most MPI performance tools • TAU • Vampirtrace • MPICH MPE • . . . User Program Call MPI_Send Call MPI_Bcast
PMPI Example (C/C++) #include <stdio.h> #include "mpi.h" staticint numsend = 0; int MPI_Send(void *buf,int count, MPI_Datatype type, int dest, int tag, MPI_Comm comm) { numsend++; returnPMPI_Send(buf, count, type, dest, tag, comm); } int MPI_Finalize() { int me; PMPI_Comm_rank(MPI_COMM_WORLD, &me); printf("%d sent %d messages.\n", me, numsend); returnPMPI_Finalize(); }
Instrumentation of OpenMP Constructs • OpenMP Pragma And Region Instrumentor • Source-to-Source translator to insert POMP callsaround OpenMP constructs and API functions • Done: Supports • Fortran77 and Fortran90, OpenMP 2.0 • C and C++, OpenMP 1.0 • POMP Extensions • EPILOG and TAU POMP implementations • Preserves source code information (#line linefile) • Work in Progress:Investigating standardization through OpenMP Forum
POMP OpenMP Performance Tool Interface • OpenMP Instrumentation • OpenMP Directive Instrumentation • OpenMP Runtime Library Routine Instrumentation • POMP Extensions • Performance Monitoring Library Control • User Code Instrumentation • Context Descriptors • Conditional Compilation • Conditional / Selective Transformations • Remarks • C/C++ OpenMP Pragma Instrumentation
OpenMP Directive Instrumentation • Insert calls topomp_NAME_TYPE(d)at appropriate places around directives • NAME name of the OpenMP construct • TYPE • fork, join mark change in parallelism grade • enter, exit flag entering/exiting OpenMP construct • begin, end mark start/end of body of construct • d context descriptor • Observation of implicit barrier atDO, SECTIONS, WORKSHARE, SINGLE constructs • Add NOWAIT to construct • Make barrier explicit
Example: !$OMP PARALLEL DO Instrumentation !$OMP PARALLEL DO clauses...do loop!$OMP END PARALLEL DO !$OMP PARALLEL other-clauses... !$OMP DO schedule-clauses, ordered-clauses,lastprivate-clausesdo loop !$OMP END DO !$OMP END PARALLEL DO NOWAIT!$OMP BARRIER call pomp_parallel_fork(d)call pomp_parallel_begin(d)call pomp_parallel_end(d)call pomp_parallel_join(d) call pomp_do_enter(d)call pomp_do_exit(d) call pomp_barrier_enter(d)call pomp_barrier_exit(d)
!$OMP PARALLEL Instrumentation call pomp_parallel_fork(d)!$OMP PARALLELcall pomp_parallel_begin(d)structured blockcall pomp_barrier_enter(d) !$OMP BARRIER call pomp_barrier_exit(d)call pomp_parallel_end(d)!$OMP END PARALLELcall pomp_parallel_join(d)
!$OMP DO Instrumentation call pomp_do_enter(d)!$OMP DOdo loop!$OMP END DO NOWAITcall pomp_barrier_enter(d)!$OMP BARRIERcall pomp_barrier_exit(d)call pomp_do_exit(d)
!$OMP WORKSHARE Instrumentation call pomp_workshare_enter(d)!$OMP WORKSHAREstructured block!$OMP END WORKSHARE NOWAITcall pomp_barrier_enter(d)!$OMP BARRIERcall pomp_barrier_exit(d)call pomp_workshare_exit(d)
!$OMP SECTIONS Instrumentation call pomp_sections_enter(d)!$OMP SECTIONS!$OMP SECTIONcall pomp_section_begin(d)structured blockcall pomp_section_end(d)!$OMP SECTIONcall pomp_section_begin(d)structured blockcall pomp_section_end(d)!$OMP END SECTIONS NOWAITcall pomp_barrier_enter(d)!$OMP BARRIERcall pomp_barrier_exit(d)call pomp_sections_exit(d)
Synchronization Constructs Instrumentation 1 call pomp_single_enter(d)!$OMP SINGLEcall pomp_single_begin(d)structured blockcall pomp_single_end(d)!$OMP END SINGLE NOWAITcall pomp_barrier_enter(d)!$OMP BARRIERcall pomp_barrier_exit(d)call pomp_single_exit(d)!$OMP MASTERcall pomp_master_begin(d)structured blockcall pomp_master_end(d)!$OMP END MASTER
Synchronization Constructs Instrumentation 2 call pomp_critical_enter(d)!$OMP CRITICALcall pomp_critical_begin(d)structured blockcall pomp_critical_end(d)!$OMP END CRITICALcall pomp_sections_exit(d)call pomp_atomic_enter(d)!$OMP ATOMICatomic expressioncall pomp_atomic_exit(d)
Synchronization Constructs Instrumentation 3 call pomp_barrier_enter(d)!$OMP BARRIERcall pomp_barrier_exit(d) call pomp_flush_enter(d)!$OMP FLUSHcall pomp_flush_exit(d)
OpenMP Runtime Library Routine Instrumentation • Transform • omp_###_lock()pomp_###_lock() • omp_###_nest_lock()pomp_###_nest_lock() [ ### = init | destroy | set | unset | test ] • POMP version • Calls omp version internally • Can do extra stuff before and after call
Performance Monitoring Library Control • Give programmer control overperformance monitoring at runtime • !$POMP INST [ INIT | FINALIZE | OFF | ON ] • Translated into • pomp_init() # initialize POMP module • pomp_finalize() # wrapup measurement • pomp_off() # disable measurement • pomp_on() # re-enable measurement • Ignored in “normal” OpenMP compilation mode
User Code Instrumentation • Compiler / transformation tool should insert • pomp_begin(d) • pomp_end(d) calls at beginning and end of each(?) user function [not yet implemented in OPARI] • Allow user-specified arbitrary (non-function) code regions • !$POMP INST BEGIN ( <region name> )arbitrary user code!$POMP INST END ( <region name> )
Context Descriptors • Describe execution contexts through context descriptor typedef struct ompregdescr {char name[];/* construct */char sub_name[];/* region name */int num_sections;char filename[];/* src filename */int begin_line1, begin_lineN;/* begin line # */int end_line1, end_lineN;/* end line # */WORD data[4];/* perf. data */struct ompregdescr* next;} OMPRegDescr; • Generate context descriptors in global static memory: OMPRegDescr rd42675 = { "critical", "phase1", 0, "foo.c", 5, 5, 13, 13 }; • Pass address to POMP functions
Conditional Compilation • C, C++, [Fortran, if supported] • #ifdef _POMParbitrary user code#endif • Fortran Free Form • !P$ arbitrary user code • Fortran Fixed Form • CP$ arbitrary *P$ user !P$ code • Usual restrictions apply
Conditional / Selective Transformations • (Temporarily) disable / re-enable POMP instrumentationat compile time • !$POMP NOINSTRUMENT • !$POMP INSTRUMENT
C/C++ OpenMP Pragma Instrumentation • No END pragmas • instrumentation for “closing” part follows structured block • adding nowait has to be done in the “opening part” • #pragma omp XXX structured block; • Simple differences in language • no “call” keyword • “;” • !$OMP#pragma omp pomp_###_begin(d); pomp_###_end(d); { }
Example: #pragma omp sections Instrumentation #pragma omp sections{ #pragma omp sectionstructured block; #pragma omp sectionstructured block;} pomp_sections_enter(d);{ pomp_section_begin(d);pomp_section_end(d); }{ pomp_section_begin(d);pomp_section_end(d); }pomp_sections_exit(d); nowait#pragma omp barrier pomp_barrier_enter(d);pomp_barrier_exit(d);
Prototype Implementation: EXPERT POMP Library void pomp_for_enter(OMPRegDescr* r) { /* Get EPILOG region descriptor stored in r */ElgRegion* e = (ElgRegion*)(r->data[0]); /* If not yet there, initialize and store it */if (! e) e = ElgRegion_Init(r); /* Record enter event */ elg_enter(e->rid);} void pomp_for_exit(OMPRegDescr* r) { /* Record collective exit event */ elg_omp_collexit();}
OPARI: Basic Usage (f90) • Reset OPARI state information by removing the state information file if it exists • rm -f opari.rc • Call OPARI for each input source file • opari file1.f90 • ... • opari fileN.f90 • Generate OPARI runtime table and compile it with ANSI C • opari -table opari.tab.c • cc -c opari.tab.c • Compile all modified output files *.mod.f90 usingOpenMP compiler • Link the resulting object files, the OPARI runtime table opari.tab.o and the POMP runtime measurement library
OPARI: Makefile Template (C/C++) OMPCC = ... # insert C OpenMP compiler hereOMPCXX = ... # insert C++ OpenMP compiler here .c.o: opari $< $(OMPCC) $(CFLAGS) -c $*.mod.c .cc.o: opari $< $(OMPCXX) $(CXXFLAGS) -c $*.mod.cc opari.init: rm -rf opari.rc opari.tab.o: opari -table opari.tab.c $(CC) -c opari.tab.c myprog: opari.init myfile*.o ... opari.tab.o $(OMPCC) -o myprog myfile*.o opari.tab.o -lpomp myfile1.o: myfile1.c myheader.hmyfile2.o: ...
OPARI: Makefile Template (Fortran) OMPF77 = ... # insert f77 OpenMP compiler hereOMPF90 = ... # insert f90 OpenMP compiler here .f.o: opari $< $(OMPF77) $(CFLAGS) -c $*.mod.F .f90.o: opari $< $(OMPF90) $(CXXFLAGS) -c $*.mod.F90 opari.init: rm -rf opari.rc opari.tab.o: opari -table opari.tab.c $(CC) -c opari.tab.c myprog: opari.init myfile*.o ... opari.tab.o $(OMPF90) -o myprog myfile*.o opari.tab.o -lpomp myfile1.o: myfile1.f90myfile2.o: ...
Outline • The KOJAK Project • An Overview and Introduction • Semi-automatic Preparation • Instrumentation of - User Functions and Regions - MPI Calls - OpenMP constructs • Automatic Analysis • EARL and its Abstractions • Performance Properties • EXPERT Analyzer and Presenter
Motivation Automatic Performance Analysis Traditional Tools:
! ! Motivation Automatic Performance Analysis (2) After lots of zooming and selecting:
Data Streams: Thread 1 Thread N Motivation Automatic Performance Analysis (3) • Main Problem: Too much data!! State Changes P2P Communication Collective Operations HPM Data Scheduler Interactions
EXPERT analyzer analysis results EXPERT presenter EARL Automatic Analysis: Current Process Semi-automaticPreparation user program executable executable run AutomaticAnalysis trace files
EARL • Problem • Low-level information in event trace • Sequential access to event records • Mapping of low-level trace onto higher-level model • Simpler specification of performance properties • Event Analysisand Recognition Language(EARL) • Implements high-level interface to event trace • C++ class embedded in Python interpreter • Random access • Abstractions expressing programming modelspecific relationships • Call tree management
Event Flow P2P Team Sync Enter Exit Send Recv Fork Join Alock Rlock MPICExit OMPCExit Basic Abstraction Mechanisms • Event Trace • Sequence of events in chronological order • Event type = set of attributes • Hierarchy of event types
Advanced Abstraction Mechanisms • Advanced Abstraction Mechanisms • State of an event • Links between related events (event relationship) • Used to represent abstractions in programming model • State of an event • State of the executing system, set of ongoing activities • Defined by set of events that caused the state • Defined inductively by transition rules • Examples • Send events of messages in transfer (message queue) • Enter events of regions currently in execution (region stack) • Exit events of collective operation just completed(MPI collective operations /OpenMP parallel constructs)