ASSIGNING GENE FUNCTION BY EXPERIMENTAL ANALYSIS
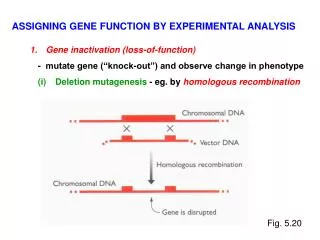
ASSIGNING GENE FUNCTION BY EXPERIMENTAL ANALYSIS. Gene inactivation (loss-of-function). - mutate gene (“knock-out”) and observe change in phenotype. Deletion mutagenesis - eg. by homologous recombination. Fig. 5.20.

ASSIGNING GENE FUNCTION BY EXPERIMENTAL ANALYSIS
E N D
Presentation Transcript
ASSIGNING GENE FUNCTION BY EXPERIMENTAL ANALYSIS • Gene inactivation (loss-of-function) - mutate gene (“knock-out”) and observe change in phenotype • Deletion mutagenesis - eg. by homologous recombination Fig. 5.20
“Deletion cassette” vector – “substituted” DNA can have selectable marker, restriction sites, “barcode tags”… Fig. 5.30 “barcode tag”= 20-25 nt sequence that will uniquely identify deletion mutant is incorporated into construct (so can detect by hybridization or PCR) Fig. 5.21
CP CP Assaying molecular barcode tags in yeast pools - yeast deletion strains with barcodes up & downstream of KanR gene In different environments (eg. drug D), which strains survive? competitive fitness in population? Presence (abundance) of different mutant strains monitored by bar code tags Microarray with complementary barcode tag sequences for all yeast genes Steinmetz Nature Rev. Genet. 5:190, 2004 So if deletion of gene X is lethal under certain growth conditions … no PCR product
Nature 418:387, 2002 - collection of 5916 gene deletion mutants - most showed no major phenotypic effect Only ~ 200 had lethal phenotype for 6 growth conditions studied Growth properties on galactose Aberrant cell morphology
(ii) Insertional mutagenesis Griffiths Fig. 14.18 Transposon tagging - if transposon inserts into gene (or into regulatory sequences) = gene inactivation Transposon tagging is “random” form of mutagenesis - so prior knowledge of gene location not required - many different alleles can be generated “From 68 biolistic experiments, we produced 271 independent transgenic events…” Bio-Rad “Biolistic particle delivery system” H. Dooner website, Waksman Institute of Microbiology, Rutgers U, New Jersey
(iii) RNA interference • short, antisense RNAs (21-25 nt length) in hybrid with • specific mRNA triggers degradation “knock-down” of gene expression T7 T7 C.elegans Alberts Fig. 8-66 “Dicer” ribonuclease cleaves specific mRNA into short ds RNAs Fig. 5.23
Study of 2769 C. elegans genes on chromosome 1 (p.202-203) - in 339 cases, saw detectable change in phenotype Emb = embryonic lethal (226) Ste = sterile (96) Unc = uncoordinated (70) Pep = post-embryonic Type of gene inactivated mature nematode 2-cell stage ~ 660 genes required for early embryogenesis Nature 408:325, 2000
2. Gene over-expression (gain-of-function) - monitor phenotypic effect of high amount of protein • transgenic experiments using cDNA of protein of interest with strong promoter, high copy number vector… Increased bone density in opg transgenic mice Simonet Cell 89:309, 1997 Fig. 5.24
3. Gene alteration Site-directed mutagenesis - introduce specific point mutation at pre-determined position (Michael Smith UBC, Nobel prize) 5’ …. ATG …. AAA TGT CCA …. TAA 3’ How to change TGT (Cys) codon to GGT (Gly) codon? Design oligomer with mismatch to original sequence 3’ … TTT CCA GGT …. 5’ Anneal to gene (ss form) & generate copies - using M13 phage system (p.156) - using two-step PCR (p.157)
Site-directed mutagenesis using PCR - useoligomer with mismatchasPCRprimer to generate product differing from template sequence at desired site Fig.T5.2
HOW TO DETERMINE WHERE AND WHEN GENE IS EXPRESSED? 1. Transformation of regulatory sequences + reporter gene Fig. 5.26 Use construct with regulatory sequences for “gene of interest upstream of reporter gene such as: lacZ – b galactosidase (blue colour) GFP – green fluorescent protein (jellyfish)
- can mutate regulatory sequences and monitor phenotypic effect… Transgenic mouse embryo Griffiths Fig. 14.27 • - regulatory sequences for gene expressed in muscle • precursor cells fused to lacZ reporter gene
2. Immunocytochemistry • - fluorescently-tagged antibody directed against protein of interest to determine subcellular location Ab for mitochondrial DNA repair protein Mol Biol Cell 16:997, 2005 Fig. 5.27
HOW TO STUDY PATTERNS OF GENE EXPRESSION ON LARGE SCALE? - to determine which sets of genes are transcribed in certain cell type developmental stage environmental condition drug treatment… 1. RT-PCR differential display 2. SAGE – serial analysis of gene expression (Fig. 6.1) 3. DNA microarrays 4. RNA-seq “Deep sequencing”
SAGE – serial analysis of gene expression Ligate many fragments together & rapid sequencing of these concatemers Fig. 6.1
Example of “RNA-seq” data Interpretation of these data? see also Topic 6, slide 15 Ramskold PLoS Comp Biol 5:e1000598, 2009
TRANSCRIPT PROFILING WITH DNA MICROARRAYS DNA chip with genes of interest (eg. clones, PCR products, oligomer barcode tags …) • RNAs extracted from control • and test cells (transcriptomes 1 & 2) 2. cDNA synthesis & labeling 5’cap AAAAAAAAAn 3’ 5’ eg. for primer can use mixture of “anchored” oligo(dT)s with A, C or G in the 3’ position 3. Hybridize to microarray 4. Visualize hybrids eg. laser scanning of fluorescence Fig. 6.3
Potential pitfalls with microarrays (see p.170-171) - if target DNA is saturated with probe, hybridization signal strength will not reflect mRNA abundance Fig.6.4 - if comparing 2 transcriptomes using 2 microarrays, data must be normalized to ensure equivalent amounts of DNA on array, same efficiency of probe labelling, same effectiveness of hybridization conditions.... so better to use 2 types of fluorescent probes on one microarray
More efficient if transcriptomes 1 & 2 are labeled with different fluorescent tags (eg “red” Cy3-dUTP & “green” Cy5-dUTP) - then mix cDNAs and hybridize to microarray - laser scanning & ratio of fluorescence calculated red = expressed at higher levels in test than in control green = expressed at lower levels in test yellow = expressed at same level in both Gibson & Muse Fig. 3.1
TRANSCRIPT PROFILING WITH DNA MICROARRAYS +drug No drug present mRNAs for genes #1-3 AAAAn AAAAn AAAAn AAAAn AAAAn AAAAn AAAAn RT Red tag genes 1-3 on chip
- then cluster analysis to identify sets of co-regulated genes • genes with related functions tend to have similar expression patterns “guilt-by-association” Transcriptome analysis during plant cell cycle PNAS 99:14825, 2002 - examined 1340 cell-cycle modulated genes in tobacco
Some genes can give rise to more than one distinctive mRNA Alternative splicing mRNAs “SpliceArrays” (microarray) - using junction-specific oligomers Fig.6.5 Aside: How many human genes show alternatively splicing? Wang et al. Nature 456:470, 2008
Some applications of DNA microarrays 1. Transcript profiling (expression analysis) 2. Genotyping (SNPs) 3. Drug discovery (eg identify potential drug targets by analyzing expression profile in response to drug)