Download
1 / 7
70 likes | 88 Views
Data Analysis Software is a tool that is used to make data analysis more efficient and convenient to use for everyone.

E N D
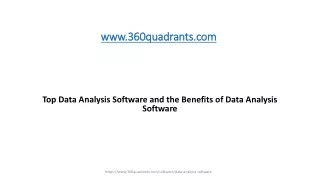
www.360quadrants.com Top Data Analysis Software and the Benefits of Data Analysis Software https://www.360quadrants.com/software/data-analysis-software
Data analysis is a process of cleaning, inspecting, transforming and modelling data into insightful results. Data Analysis Software is a tool that is used to make data analysis more efficient and convenient to use for everyone. Data analysis software provides clearer insights into the data being used. These insights can be used for spotting business trends and areas of improvement, growth of business and new opportunities for business. Different types of data can be analyzed such as descriptive, diagnostic, predictive and prescriptive.Top Data Analysis Software Tools are listed below –Zoho Analytics – Zoho Analytics is a self-service business intelligence and data analytics software that lets you create visually appealing data visualizations and insightful dashboards in minutes. It allows users to convert huge amounts of raw data into insightful reports and dashboards and tracks key business metrics, longtime trends, identify outliers, and unearth hidden insights.SAS–Data analysis can be conducted with SAS Enterprise Guide. The allows uses to combine various datasets into one main dataset to use efficiently and to conduct analysis. It works well with the analysis of statistical datasets.Atlas.Ti – Atlas.ti is a tool that analysis the qualitative aspects of large bodies of textual, graphical, audio and video data. It helps uses to structure data in a creative and readable manner irrespective of the topic of data. The tools allow users to link their data in a manner that allows end-users to better understand the content in a short time frame. https://www.360quadrants.com/software/data-analysis-software
Bouquet – Bouquet provides data analysis in a chat interface. The user simple loads the datasets and can send a query like a chat and a bot will conduct the analysis and provide the user with the results. It can be used on mobiles and saves users a considerable amount of time. Bouquet is also compatible with Siri which makes it easier to use for its users. Databricks – Databricks is an open unified platform. It caters to engineering and science data analysis. It allows users to access and explore data more quickly, discover and share new insights, and create models with languages and tools of the user’s choice. It offers easy access to preconfigured ML environments for augmented machine learning with state of the art and popular ML frameworks. It provides users access to a central repository and helps users to track and share experiments, reproduce runs, and manage models collaboratively. Flurry – Flurry is a free analysis application. It is specially designed for app develops to conduct quick analysis on their apps. It provides users with data on their audience such as age, gender, location, engagement, device information, and more. It also enables the segmentation of customers. It also provides analysis on how users engage with the app and what brings them back for more. Information Builders – Web FOCUS Rstat provides full integration with R and Python network systems, models, and statistical functions and allows scientists and citizens to contribute directly to BI and analytics content. It also provides data access and cleansing tools to ensure organizations are working with trusted data. It caters to a wide range of users and offers support for data scientists who can develop advanced analytics, AI, and machine learning; for citizen data scientists who can employ augmented models and statistics; and everyday users who can securely consume and benefit from analytics that incorporate predictions, recommendations, and even automation. https://www.360quadrants.com/software/data-analysis-software
Magellan – Magellan, a product of open-text, offers features such as advanced machine learning models, big data analytics, text analytics, data visualization, data science notebooks and flexibility and scalability options. Magellanhelps to reduce costs in analysis increase productivity and decision making of the organization. MapR – MapR provides implementation data migration, tuning and optimization, data engineering and advance analytics. Cluvio – Cluvio is a cloud analytics platform for startups and data-driven teams. It uses SQL and R to analyze data and create beautiful, interactive dashboards for the entire company or teams in a few minutes. Other data analysis software tools include FactoryTalkInnovationSuite, Idea, Informer, Kissmetrics, Kyubit Business Intelligence, Mammoth, MemSQL, MicroStrategy Enterprise Analytics, Minitab 19, MIPAR, NVivo, OriginPro, Phocas Software, PINpoint, Promethium, Qubole, Sawmill, Scoreboard, Stata, Tonic, Wolfram Mathematica, Workbench, YouGov. https://www.360quadrants.com/software/data-analysis-software
Benefits of Data Analysis Software Saves time as users need now carry out routine tasks manually. Greater accuracy is provided with models, estimations and simulations. Can carry out analysis on huge volumes of data in a short span of time. Smoother and efficient decision-making process due to the availability of accurate and timely data. Provides intel for business develop and growth or mitigation and prevention of risk. https://www.360quadrants.com/software/data-analysis-software
About 360Quadrants 360Quadrants is the largest marketplace looking to disrupt US $3.7 trillion of technology spend and is the only rating platform for vendors in the technology space. The platform provides users access to unbiased information that helps them make qualified business decisions. 360Quadrants enables vendors to influence the business decisions of potential clients. Vendors get to win ideal new customers, customize their quadrants, decide key parameters, and position themselves strategically in a niche space, to be consumed by giants and start-ups alike. Experts get to grow their brand and increase their thought leadership. The platform targets the building of a social network that links industry experts with companies worldwide. The platform has around 400 total buyers across various markets. https://www.360quadrants.com/software/data-analysis-software
Contact: Mr. AgneySugla agney@marketsandmarkets.com 630 Dundee Road, Suite 430 Northbrook, IL 60062 https://www.360quadrants.com/software/data-analysis-software