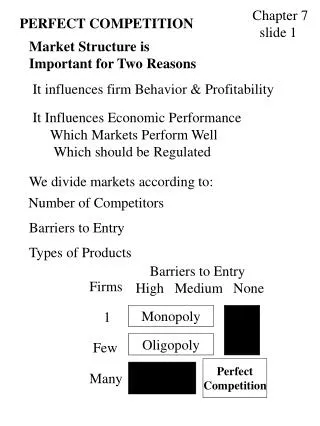
Download
1 / 9
90 likes | 222 Views
Chapter 7 delves into the significance of market structures, focusing on perfect competition. It explains how market structures impact firm behavior and profitability and influences overall economic performance. Key elements include the number of competitors, barriers to entry, and types of products. The chapter discusses equilibrium pricing, shifts in supply and demand, and the outcomes in competitive markets. It illustrates concepts with real examples like day-care pricing and trade implications, providing insights into how competitive markets function efficiently to meet consumer needs.

E N D
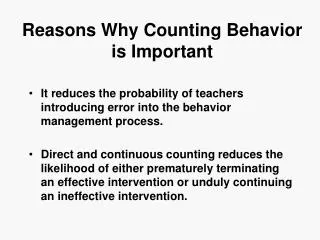
PERFECT COMPETITION Chapter 7 slide 1 Market Structure is Important for Two Reasons It influences firm Behavior & Profitability It Influences Economic Performance Which Markets Perform Well Which should be Regulated We divide markets according to: Number of Competitors Barriers to Entry Types of Products Barriers to Entry High Medium None Firms 1 Few Many Monopoly Oligopoly Perfect Competition
BASICS OF SUPPLY & DEMAND 7.2 The competitive equilibrium occurs at P = $25 and Q = 8 thousand shoes. The increase (shift) in demand results in a higher price and a greater output. Price Supply Demand $25 0 4 8 12 16 Pairs of Shoes
SUPPLY & DEMAND 7.3 The fall in the marginal cost of production causes a favorable shift in supply and a lower price accompanied by greater output. Price Supply Demand $25 0 4 8 12 16 Pairs of Shoes
Revenue & Cost per unit MC AC P = $8 Output PERFECT COMPETITION 7.4 Firm Behavior Each firm is a price taker (MR = P). Each firm sets its QF such that P = MC. In long-run equilibrium, price is bid down until: P = MR = MC = ACMIN P = $6 QF QF
D’ Supply Curve before Entry D $8 $6 $4 | | 0 200 240 280 300 7.5 Perfect Competition: Industry Outcome Initial Equilibrium: P = $6 & Q = 200. After an increase in demand, the short-run result (before entry) is: P = $8 & Q = 240. The long-run result (after entry) is: P = $6 & Q = 280. Supply Curve after Entry
7.6 PRIVATE MARKET EFFICIENCY Competitive Markets Provide the “Right” Amounts of Goods and Services that People Want and at Least Cost. The Argument goes back to Adam Smith’s “Invisible Hand” Metaphor. We’ll Sketch the Argument Starting with: Individual Transactions and Building up to Competitive Markets.
Couple’s Maximum Value Consumer Surplus $20 per Week Producer Profit $40 per Week Consumer Surplus $20 per Week $10 - 8 - 6 - 4 - 2 - 0 Producer Profit $20 per Week | | | | | | 0 2 4 6 8 10 12 Granny’s Cost 7.7 Parents of a Two-Year Old are Willing to Pay $8 per hour for up to 10 hours of Day Care per Week. A DAY-CARE EXAMPLE The Granny Down the Street will provide Care for $4 per Hour. Can the Parties bargain to a mutually beneficial agreement? Yes What if a second couple is willing to pay $10 per hour? P = $
7.8 A COMPETITIVE DAY-CARE MARKET All Buyers Pay Same Price. Regional Day-Care Demand High Valuers Obtain Day Care. 12 - 10 - 8 - 6 - 4 - 2 - 0 Low-Cost Firms Supply Day Care. MB The Competitive Quantity is Efficient. Grandmothers Day-Care Supply $2.50 “Store-Bought” Day Care MC | | | | | | | 2 4 6 8 10 12 14 QC = 9.5
US Demand US Supply $15 World Price under Free Trade $12.50 US Imports TRADE BARRIERS & DEADWEIGHT LOSS 7.9 DWL 15 20 25 Deadweight loss under trade prohibition is greater than w/ a $1.50 tariff. US Demand US Supply $15 $14 World Price under Free Trade DWL DWL $12.50 Imports 18 22