Download
1 / 32
320 likes | 494 Views
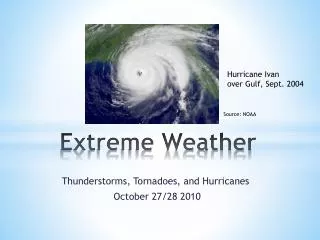
NOAA’s National Weather Service. Extreme Weather Understanding the Impacts and Associated Risks. Ernie Wells Victor Hom Hydrologic Services Division NWS Office of Climate, Water and Weather Services Patricia Brown Weather Forecast Office – New Orleans, LA. National Weather Service.

E N D
NOAA’s National Weather Service Extreme Weather Understanding the Impacts and Associated Risks Ernie Wells Victor Hom Hydrologic Services Division NWS Office of Climate, Water and Weather Services Patricia Brown Weather Forecast Office – New Orleans, LA
National Weather Service Overview • NWS Hydrologic Services • Weather Forecast Office Operations • River Forecast Center Operations • Extreme/Severe Weather • Decision Support for Inland and Coastal Flooding
National Weather ServiceHydrologic Services Presentation Overview • Hydrologic Services Forecast Process • Advanced Hydrologic Prediction Service (AHPS) Delivery • Beyond the Forecast – Understanding the information
Floods versus Flash Floods River Flood • River rises to flood stage over many hours or days( i.e. > 6 hours from causative event) • Longer lasting events • Hydrometeorological event • Flash Flood • Quick responding streams and rivers(i.e. reach flood stage in < 6 hours after the causative event) • Typically a meteorological event resulting from heavy rainfall or other circumstances, such asan ice-jam, dam break, or levee failure. 4
Hydrologic Service Delivery • National Center for Environmental Prediction (NCEP) Centers • HPCQPF, Excessive Rainfall Product • SPCHeavy Rain Mesoscale Discussion • CPC6-10 day, 8-14 day, and monthly / seasonal products for temperature and precipitation anomaly ACUS3 KMKC 041249 SWOMCD MKC MCD 041249 OKZ000-041600- SPC MESOSCALE DISCUSSION #0353 FOR SOUTHWEST TO NORTHEAST OKLAHOMA CONCERNING...HEAVY RAINFALL... RAINFALL RATES UP TO 3 INCHES PER HOUR CAN BE EXPECTED TO CONTINUE FOR THE NEXT FEW HOURS IN A 50 MILE WIDE BAND FROM COMANCHE COUNTY NORTHEASTWARD ACROSS OKC TO OSAGE COUNTY. TRAINING THUNDERSTORMS HAVE DEVELOPED RAPIDLY FROM JUST EAST OF LAWTON THROUGH OKC TO JUST WEST OF BARTLESVILLE. 12Z SURFACE ANALYSIS SHOWS ….
Hydrologic Service Delivery • River Forecast Centers (RFCs) • Products • Quantitative Precipitation Forecast • Multi-sensor Precipitation Analyses • Short and Extended River Forecast Guidance (deterministic and probabilistic) • Significant River Flood Outlook • Flash Flood Guidance • Water Supply Forecasts • Additional Services • Routine Multi-Agency Collaboration • (USGS, USACE, USBR, NRCS, others) • Extended service/hours and additional • staff during flood events • Outreach, training, and general WFO • support • Model Calibration, Verification, and other development activities
Hydrologic Service Delivery • Weather Forecast Offices (WFOs) • 24x7 Hydromet Watch Function • Flash Flood Watches and Warnings • River Forecasts and Warnings • Event-based decision support services • Quantitative Precipitation Forecast (QPF) • Flash Flood Verification (LSRs and Storm Data Reports) • Web service delivery QA/QC • Real-time Precipitation and River Gage Data • Analysis and Quality Control • Local data network management, such as equipment and database management (e.g. IHFS ) • Local outreach and education • (Service Hydrologist, HFP, or WCM) WGUS42 KTAE 021419 FLWTAE FLOOD WARNING NATIONAL WEATHER SERVICE TALLAHASSEE FL 919 AM EST TUE DEC 02 2008 OCHLOCKONEE RIVER NEAR CONCORD AFFECTING GADSDEN AND LEON COUNTIES ...MODERATE FLOODING IS OCCURRING...FORECAST TO FALL BELOW FLOOD STAGE... SAFETY MESSAGE...ALL PERSONS WITH INTEREST ALONG THE RIVER SHOULD MONITOR THE LATEST FORECASTS...AND BE PREPARED TO TAKE NECESSARY PRECAUTIONS TO PROTECT LIFE AND PROPERTY. DO NOT DRIVE CARS THROUGH FLOODED AREAS. IF YOU SEE FLOOD WATERS...REMEMBER TO TURN AROUND AND DO NOT DROWN. FLC039-073-031419- /O.CON.KTAE.FL.W.0049.000000T0000Z-000000T0000Z/ /CONF1.2.ER.081201T0846Z.081202T1401Z.000000T0000Z.UU/ 919 AM EST TUE DEC 02 2008 ... OBSERVED FLOODING INCREASED FROM MINOR TO MODERATE SEVERITY... THE FLOOD WARNING CONTINUES FOR THE OCHLOCKONEE RIVER NEAR CONCORD. * UNTIL FURTHER NOTICE...OR UNTIL THE WARNING IS CANCELLED. * AT 9:01 AM TUESDAY THE STAGE WAS 32.2 FEET. * FLOOD STAGE IS 30.0 FEET. $$
The Warning Process Observe, monitor, detect, forecast and generate warning 3 Respond 1 2 Disseminate warning
Product Dissemination • Internet (http://www.weather.gov/) • NOAA Weather Radio All Hazards • Emergency Managers Weather Information Network • NOAA Weather Wire Service • NOAAPORT • Emergency Alert System (EAS)
Performance Measurement Flash Flood WarningVerification • Statistics based on product issuance information and confirmation of actual flash floods by the local WFOs • Flash Flood Warning Lead Time • Flash Flood Warning Accuracy * Beginning in Oct 07, the NWS effected a transition to storm-based flash flood warning services. FY10 represents the first year this method was used to report the official performance metrics.
Performance Measurement National River Flood Warning Verification • All River Response • River Flood Warning Lead Time • River Flood Warning Accuracy • Absolute Timing Error • Number of Warnings
Advanced Hydrologic Prediction Service (AHPS) • Provide enhanced water availability and flood warning information by leveraging NOAA’s infrastructure and expertise • Modernize services through infusion of new science and technology • - Flash-flood to seasonal freshwater forecasts • - Quantification of forecast certainty • - More accurate and timely forecasts and warnings • - Partnered flood-forecast area mapping • - Visually-oriented products • Provide consistent access to standardized graphics via web interface
Advanced Hydrologic Prediction Service (AHPS) Expanding AHPS Coverage $60 million/10 year program (completion year of 2014) Over 3,500 forecast locations with new Web-based services AHPS 60% complete $766 million estimated annual recurring benefit (National Hydrologic Warning Council study)
Accessing AHPS Information “click on” the water tab for current river conditions http://weather.gov/
Accessing AHPS Information “click on” the forecast location to access local hydrograph http://water.weather.gov/
Accessing AHPS Information “click on” tabs for probabilistic forecasts Currently demonstrating components of short-range ensemble capabilityat 6 River Forecast Centers and plan to begin national implementation in FY12
AHPS Precipitation Observations Information http://water.weather.gov/precip/ • Multisensor Observed Precipitation: • Daily • Past 7, 14, 30 and 60 days • Year and Water Year-to-date • Historical Monthly totals • Analysis: • Period Normal • Departure from Normal • Percent of Normal
Snowmelt Water Supply Forecasts Water Supply in the western US is from mountain snowpack. Calculated April through July runoff period Issued semi-monthly from January to June. http://wateroutlook.nwrfc.noaa.gov/maps/wsf
Extreme Flooding • Atlanta, GA September 19-23, 2009 • 10-20 inches of rain in 24 hours • 11 fatalities • $250 Million in damages • Record river flows • Central New Jersey, March 12-15, 2010 • 3-6 inches of rain in 48 hours on top of 4-8 inches of Snow Water Equivalent • $63 million in damages • Rhode Island March 29-30, 2010 • 6-10 inches of rain in 48 hours onto saturated soils and upstream snowmelt • $86 million in damages
Extreme Flooding • Nashville, TN May 1-3, 2010 • 10-16 inches of rain in 48 hours • 31 fatalities • $2.3 billion in damages • Arkansas June 11, 2010 • 4-7 inches of rain in 24 hours most fell in about 6 hours • 20 fatalities • $9 million in damages • River rose 20 feet in just a few hours • Oklahoma City, OK June 14, 2010 • Up to 10 inches of rain in 12 hours • 1 fatality • $6 Million in damages
Extreme Flooding • East Central Alaska July 10-11, 2010 • 4 inches of rain in 24 hours • 1 fatality • $6 million in damages • Record stage at Taylor Highway Bridge • Iowa and Wisconsin July 22-24, 2010 • 6-12 inches of rain in 24 hours • $37 Million in Milwaukee area damages (media estimate) • Lake Delhi Iowa dam failure (no preliminary estimate of damages available) • South Texas July 2010 • Tropical moisture from Hurricane Alex and TD#2 caused more than 50 inches of rain over 10 days (in Mexico, Rio Grande Basin) • $70 million in damages (preliminary estimate)