Download
1 / 13
130 likes | 243 Views
This report analyzes the meteorological conditions and aerosol patterns observed during the July 1995 episode, which lasted from the 8th to the 18th. It highlights the diurnal cycle of relative humidity (RH) in the Eastern US, affecting aerosol extinction coefficients, peaking in the early morning. The episode saw shifting air masses, initially dominated by a Canadian system, leading to fluctuations in aerosol concentrations across the Midwest. Although the episode was less intense than others that summer, significant patterns in visibility and aerosol dynamics were noted, correlating with PM2.5 and other particulate matter measurements.

E N D
Aerosol and Meteorological Patterns During the July 1995 Episode Models3 Evaluation Project. CAPITA June 18 2000
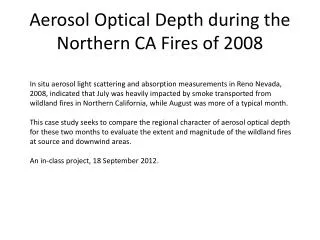
Bext Diurnal Cycle – 7/15/95 • Relative humidity follows a pronounced diurnal cycle. In the Eastern US during the summer the RH is ~90% in the morning and evenings and ~60% in the mid afternoon. • This causes a significant diurnal cycle of aerosol extinction coefficient, the highest values occurring in the early morning hours
Summary of the Bext and Meteorology during 1995 Aerosol Episode • The 1995 episode extended for ten days from July 08 through July 18. • Prior to the episode a swift Canadian airmass descended over most of the northern and central Eastern US.resulting in low aerosol concentrations throughout the domain, particularly in the north. • Between July 8 and 12 Canadian airmass stagnated over Iowa - Ohio and the aerosol extinction coefficient increased to over 0.3 km-1 at a number monitors in the Midwest. • During the next four days, the airmass meandered over the Midwest and the aerosol levels increased further peaking on July 13-15. • The transport then shifted to stronger persistent flow to the east and aerosol concentrations in the Midwest fell with decreases occurring in western part of the Midwest first. • By July 18, only the Eastern Atlantic states had elevated aerosol levels. • The diurnal cycle of RH causes a significant diurnal cycle of aerosol extinction coefficient, the highest values occurring in the early morning hours • The July 95 aerosol episode was not particularly intensive compared to other episodes in the summer of 1995.