Download
1 / 13
130 likes | 144 Views
This research paper discusses the relevance of stop detection in surveys and its application in travel surveys, time use surveys, and geo-fencing in expenditure and food surveys. It also presents the methodology and IT choices for stop detection and analyzes the results of a field test conducted for a Dutch Travel survey. The research aims to determine the optimal stop detection parameters for data quality, its impact on missing data and break-offs, and the relationship between stop detection parameters and traveled distances.

E N D
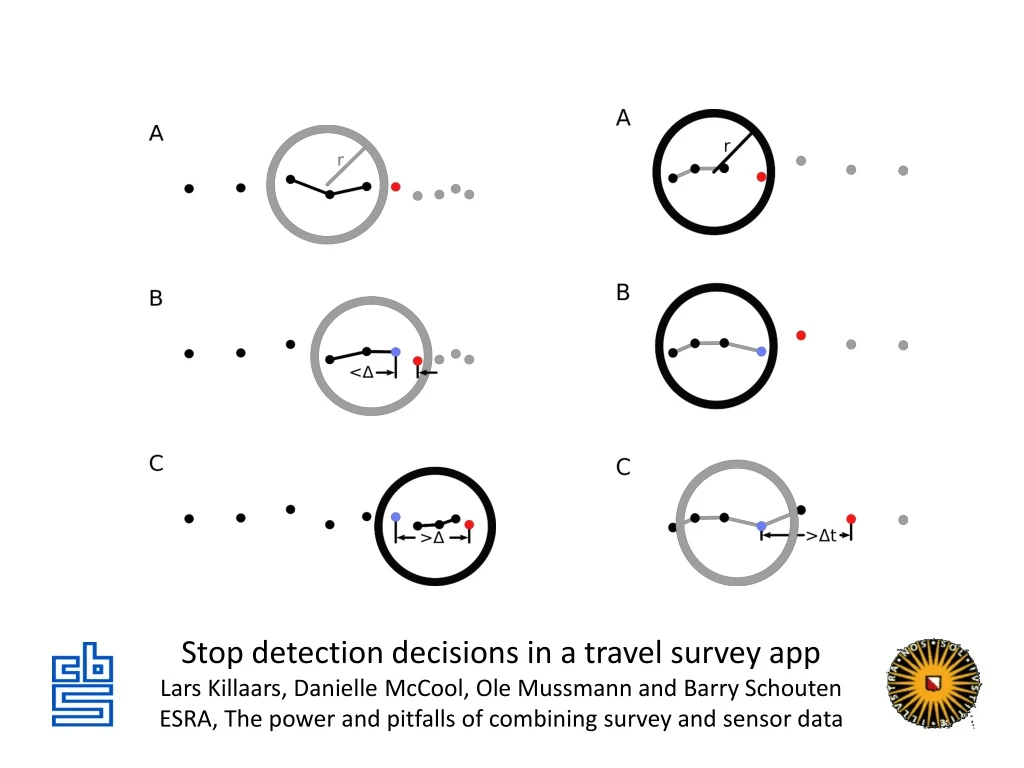
Stop detectiondecisions in a travel survey app Lars Killaars, Danielle McCool, Ole Mussmannand Barry Schouten ESRA, The power andpitfalls of combining survey and sensor data
Why stop detection is relevant in surveys? • Stop detection splits a series of time-location sensor data (GPS, WiFi, GSM) intostopsand tracks, i.e. addspurposeandmeaning • Stopsand tracks are usefulingredientstomanysurveys: • Travel surveys • Time usesurveys • Geo-fencing in expendituresurveysand food surveys • In active sensor data collection, stop detection is crucial in order toaskrespondentsfor feedback, validationandsupplemental data Stop detection, July 17, ESRA 2019, Zagreb
What is a stop? • Complicated question thatis answeredambiguouslybysubstantiveresearchers. • In paper/online travelsurveys, this is lefttotherespondentswithsome basic instruction • Here: A person has a stop when • he/she is in a certain area for at least a certain time period, • he/she is therewith a purposethat is different from a change of transportation mode • A change of transportation mode splits tracks intosubtracks Stop detection, July 17, ESRA 2019, Zagreb
Stop detection: methodologyand IT chocies • A candidate stop is detectedwhen a respondent resides in an area of with perimeter smaller than r for at least a duration of d minutes. • Start/end times/averagelocation are slightly more complicated, because a respondent can move while in a stop, e.g. duringwork • IT choices: • Choice of a high and low tracking mode to save battery • Frequency of tracking in both tracking modes • Accuracy of locationmeasurements • Keeping app active on background Stop detection, July 17, ESRA 2019, Zagreb
Design of field test for Dutch Travel survey • n=1902 sample units from Dutch population of >=16 yearswere • invitedtoinstallthetravel survey app andtoparticipatefor a week • Sample units werevariedrandomly over • Durationd: {2,3,4,5} minutes • Perimeter r: [60,100] meters • All r=674 sample units thatregistered, wereaskedforan online survey • In the analysis, we simulated d ϵ{1,1.5,2,3,5,7,10} min, r ϵ[10,100] m Stop detection, July 17, ESRA 2019, Zagreb
Design of field test for Dutch Travel survey Stop detection, July 17, ESRA 2019, Zagreb
Research questionsin travel survey experiment • Do reported respondent issues depend on stop detectionrules? • What are optimal stop detection parameters for data quality? • Do stop detection parameters impact missing data/break-off? • Do stop detection parameters impact traveleddistances? Stop detection, July 17, ESRA 2019, Zagreb
RQ1RQ1: Reported stop detection issues Figure 7: Answers of respondents to the question: How does the number of stops that the app found compare to the amount of stops you expected? Stop detection, July 17, ESRA 2019, Zagreb
RQ2: averagenumber of stops as function of (d,r) Stop detection, July 17, ESRA 2019, Zagreb
RQ3: missing data/break-off • No association at all between stop detection parameters and break-off/attrition • Incentive conditions 5 + 5+ 5, 5+ 0 + 10, 5 + 0 + 20 Stop detection, July 17, ESRA 2019, Zagreb
RQ4: stop and track durations as function of (d,r) Stop detection, July 17, ESRA 2019, Zagreb
RQ4: stop and track durations - continued Figure 5: Percentage of stops/tracks with a duration/distance that falls within the specified boundaries on the right. Shown for all used time parameters. Stop detection, July 17, ESRA 2019, Zagreb
Conclusionsandfuture • Issues reportedbyrespondents show weakrelationto parameters • Number of stops is robust, unlessunrealistically small/short • Attritionshowed no relationto parameters • Parameters have slight impact on travelstatistics • Future: • Furtherimprovement of stop detection is onlyfeasibleusing online geolocation databases/points-of-interest • Commercial apps includeindividuallearning, but require >7 days • Keeping app active is a crucial IT challenge Stop detection, July 17, ESRA 2019, Zagreb